 My GeoNetwork catalogue
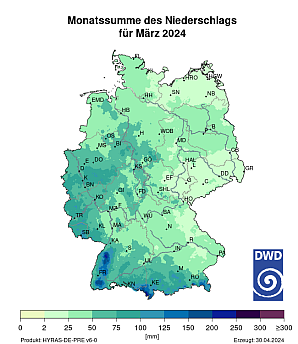
Raster data set precipitation sums in mm for Germany - HYRAS-DE-PR
These grids are a product derived from HYRAS-DE-PR. HYRAS-DE-PR is a precipitation product for Germany in a 1 km x 1 km grid for the period 1931 to the previous day and is based on daily measured values of precipitation height. The data set can be used, for example, for the analysis of past climate, for bias adjustment of regionalized climate projection data and as input data for hydrological modeling.
Simple
- Alternate title
-
HYRAS-DE-PR
- Date (Publication)
- 2024
- Edition
-
v6.0
- Edition date
- 2024
- Citation identifier
-
urn:wmo:md:de-dwd-cdc:03b07962-a55d-48df-aac3-91fe44172ced
CDC2.1:WMO-URN CDC2.1:WMO-URN CDC2.1:WMO-URN 2024
- Presentation form
- Digital map
- Presentation form
- Digital table
- Status
- On going
+ 49 (0) 69 8062-4499
https://dwd.de
- Hours of service
-
09:00 - 16:00
- Maintenance and update frequency
- Daily
- Update scope
- Dataset
- Maintenance note
-
The data is extended every day. It should be noted that at the beginning and middle of each month, the previous month is recalculated with quality-controlled measurements and the data of the current year is overwritten. To improve quality, station data from neighboring countries is also taken into account where available. This currently applies from 1951-2020.
https://dwd.de
- Hours of service
-
09:00 - 16:00
- Maintenance and update frequency
- Unknown
- Update scope
- Dataset
- Dataset
-
Version
- Maintenance note
-
The DWD reserves the right to update or provide a new version of the data set at its own discretion.
https://dwd.de
- Hours of service
-
09:00 - 16:00
-
INSPIRE - Spatial scope
-
-
National
-
-
DWD Climate Data Center Vocabulary - Datenherkunft
-
-
grids
-
-
DWD Climate Data Center Vocabulary - Parameterklasse
-
-
precipitation
-
-
DWD Climate Data Center Vocabulary - Parameter
-
-
precipitation height
-
-
DWD Climate Data Center Vocabulary - Einheit
-
-
mm
-
-
DWD Climate Data Center Vocabulary - Statistische Bearbeitung
-
-
monthly sum
-
daily sum
-
multi-annual averages
-
- Keywords
-
-
opendata
-
-
DWD Climate Data Center Vocabulary - Geoserver Dimension: Zeit
-
-
1 month
-
30 years
-
24 hours
-
-
GEMET - INSPIRE themes, version 1.0
-
-
Meteorologisch-geografische Kennwerte
-
Atmosphärische Bedingungen
-
- Specific usage
-
Uncertainties may result from the interpolation method used. Incorrect measurements also result in uncertainties in the grid field. For the interpolation of the grids, a different number of stations were used over time, as the measurement network has changed. This must be considered when comparing different years. Please also note the recommendations on uncertainties and interpretation of grid points of station-based grid data https://opendata.dwd.de/climate_environment/CDC/help/Empfehlungen_Gitterdaten_DACH.pdf
- User determined limitations
- uncertainties
- User determined limitations
- considerations
- Access constraints
- Other restrictions
- Other constraints
- no Limitations
- Use constraints
- Other restrictions
- Other constraints
- The Creative Commons BY 4.0 - Licence 'CC BY 4.0' apply.
Aggregation Information
- Spatial representation type
- Grid
- Language
- Deutsch
- Topic category
-
- Climatology, meteorology, atmosphere
- Geoscientific information
))
- Geographic identifier
- Germany
- Begin date
- 1931-01-01
- End date
- -P1D Now
- Unique resource identifier
- EPSG:3035
- Number of dimensions
- 3
- Dimension name
- Row
- Dimension size
- 1100
- Resolution
- 1 km
- Dimension name
- Column
- Dimension size
- 1200
- Resolution
- 1 km
- Dimension name
- Time
- Resolution
- 1 day
- Cell geometry
- Area
- Distribution format
-
-
OGC Services and OpenData files (free access)
(
)
-
netcdf
(
)
-
OGC Services and OpenData files (free access)
(
)
https://dwd.de
- Hours of service
-
10:00 - 15:00 ME(S)Z
- OnLine resource
- Rauthe, M., Steiner, H., Riediger, U., Mazurkiewicz, A., Gratzki, A., 2013: A Central European precipitation climatology – Part I: Generation and validation of a high-resolution gridded daily data set (HYRAS) Meteorologische Zeitschrift Vol. 22 No. 3, p. 235 – 256, 2013 ( WWW:LINK-1.0-http--link )
- OnLine resource
-
pr_hyras_*_v6-0_de_monsum.nc (monthly)
(
WWW:LINK-1.0-http--download
)
The grids are written to a NetCDF file. The file of the current year is extended every day. The name of the NetCDF file is defined as follows: parameter_productname_resolution(in km)_year_version_region_monthlysums.nc (e.g. pr_hyras_1_2021_v6-0_de_monsum.nc)
- OnLine resource
-
pr_hyras_*_v6-0_de_*.nc (multi-annual)
(
WWW:LINK-1.0-http--download
)
The grids are written to a NetCDF file. The file of the current year is extended every day. The name of the NetCDF file is defined as follows: parameter_productname_resolution(in km)_periode_version_region_timescale.nc (e.g. pr_hyras_1_1991_2020_v6-0_de_APR.nc)
- OnLine resource
-
Recommendation for raster data
(
WWW:LINK-1.0-http--link
)
DACH recommendations on uncertainties and interpretation of grid point values of station-based gridded data
- OnLine resource
-
pr_hyras_*_v6-0_de.nc (daily)
(
WWW:LINK-1.0-http--download
)
The grids are written to a NetCDF file. The file of the current year is extended every day. The name of the NetCDF file is defined as follows: parameter_productname_resolution(in km)_year_version_region.nc (e.g. pr_hyras_1_2021_v6-0_de.nc)
- Hierarchy level
- Dataset
Conformance result
- Date (Publication)
- 2010-12-08
- Pass
- Yes
Conceptual consistency
- Name of measure
- quality_estimation
Conformance result
- Explanation
-
see Rauthe et al., 2013.
- Pass
- Yes
- Statement
-
The interpolation is based on the daily measured values of the precipitation height (6UTC - 6UTC of the following day). The daily updates measurements do not undergo a complete quality control. These measured values are initially only checked for threshold values and a simple grid control is performed. At the beginning and middle of each month, the previous month is recalculated and overwritten with quality-controlled measurements to ensure high quality of the raster data.
The method for regionalizing observed daily precipitation heights is essentially based on the interpolation of anomalies with respect to long-term mean values (background field). The monthly background fields are determined by a multiple linear regression, in which mean monthly station measurement from the period 1971-2000, longitude and latitude, height above sea level and direction and amount of exposure are used as input variables. The station measurements used to determine the background field undergo a quality control. To calculate the daily grids, anomalies are calculated from the station data and these are interpolated, distance weighted, to unoccupied grid centers using the four closest stations to the grid point.
- File identifier
- urn:wmo:md:de-dwd-cdc:03b07962-a55d-48df-aac3-91fe44172ced XML
- Metadata language
- Deutsch
- Character set
- UTF8
- Hierarchy level
- Dataset
- Date stamp
- 2024-11-21T06:05:16
- Metadata standard name
-
ISO 19115-2 Geographic information Metadata Part 2: Extensions for imagery and gridded data
- Metadata standard version
-
ISO 19115-2:2009-02-15
https://dwd.de
- Hours of service
-
09:00 - 16:00
- Dataset URI
-
urn:wmo:md:de-dwd-cdc:03b07962-a55d-48df-aac3-91fe44172ced
Overviews
Spatial extent
Provided by
