 My GeoNetwork catalogue
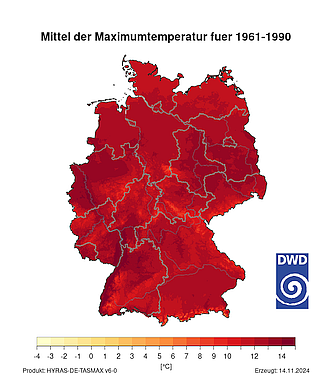
Raster data set of maximum temperature in °C for Germany - HYRAS-DE-TASMAX v6-1
HYRAS-DE-TASMAX is a temperature product for Germany in a 1 km x 1 km grid for the period 1951 to the previous day and is based on daily measured maximum values of temperature. The data set can be used, for example, for the analysis of past climate, for bias adjustment of regionalized climate projection data and as input data for hydrological modeling.
Simple
- Alternate title
-
HYRAS-DE-TASMAX
- Date (Creation)
- 2025
- Edition
-
v6-1
- Edition date
- 2025
- Citation identifier
-
urn:wmo:md:de-dwd-cdc:ec363a6b-e628-4a9b-bde4-fdddd2db67e9
CDC2.1:WMO-URN CDC2.1:WMO-URN CDC2.1:WMO-URN 2025
+ 49 (0) 69 8062-4499
https://dwd.de
- Hours of service
-
09:00 - 16:00
- Presentation form
- Digital map
- Presentation form
- Digital table
- Status
- On going
+ 49 (0) 69 8062-4499
https://dwd.de
- Hours of service
-
09:00 - 16:00
Point of contact
- Maintenance and update frequency
- Daily
- Update scope
- Dataset
- Maintenance note
-
The data is extended every day. It should be noted that at the beginning and middle of each month, the previous month is recalculated with
quality-controlled measurements and the data of the current year is overwritten.
To improve quality, station data from neighboring countries is also taken into account where available. This currently applies from 1951-2020.
The DWD reserves the right to update or provide a new version of the data set at its own discretion.
https://dwd.de
- Hours of service
-
09:00 - 16:00
-
INSPIRE - Spatial scope
-
-
National
-
-
DWD Climate Data Center Vocabulary - Datenherkunft
-
-
grids
-
-
DWD Climate Data Center Vocabulary - Parameterklasse
-
-
temperature
-
-
DWD Climate Data Center Vocabulary - Parameter
-
-
air temperature at 2 m
-
-
DWD Climate Data Center Vocabulary - Einheit
-
-
°C
-
-
DWD Climate Data Center Vocabulary - Statistische Bearbeitung
-
-
multi-annual averages
-
monthly means of daily max
-
daily max
-
- Keywords
-
-
opendata
-
-
GEMET - INSPIRE themes, version 1.0
-
-
Atmosphärische Bedingungen
-
Meteorologisch-geografische Kennwerte
-
-
DWD Climate Data Center Vocabulary - Geoserver Dimension: Zeit
-
-
1 month
-
1 day
-
30 years
-
- Specific usage
-
Uncertainties may result from the interpolation method used. Incorrect measurements also result in uncertainties in the grid field. For the interpolation of the grids, a different number of stations were used over time, as the measurement network has changed. This must be considered when comparing different years. Please also note the recommendations on uncertainties and interpretation of grid points of station-based grid data (Recommendations for raster data).
- User determined limitations
- uncertainties
- User determined limitations
- considerations
+ 49 (0) 69 8062-4499
https://dwd.de
- Hours of service
-
09:00 - 16:00
- Access constraints
- Other restrictions
- Other constraints
- no Limitations
- Use constraints
- Other restrictions
- Other constraints
- The Creative Commons BY 4.0 - Licence 'CC BY 4.0' apply.
Aggregation Information
- Spatial representation type
- Grid
- Language
- Deutsch
- Topic category
-
- Climatology, meteorology, atmosphere
- Geoscientific information
))
- Geographic identifier
- Germany
- Begin date
- 1951-01-01
- End date
- -P1D Now
- Unique resource identifier
- EPSG:3035
- Number of dimensions
- 3
- Dimension name
- Row
- Dimension size
- 890
- Resolution
- 1 km
- Dimension name
- Column
- Dimension size
- 665
- Resolution
- 1 km
- Dimension name
- Time
- Resolution
- 1 day
- Cell geometry
- Area
- Distribution format
-
-
netcdf
(
)
-
netcdf
(
)
+ 49 (0) 69 8062-4499
https://dwd.de
- Hours of service
-
09:00 - 16:00
- OnLine resource
- Razafimaharo, C., Krähenmann, S., Höpp, Rauthe, M., Deutschländer, T. (2020): New high-resolution gridded dataset of daily mean, minimum, and maximum temperature and relative humidity for Central Europe (HYRAS). Theor Appl Climatol 142, 1531–1553 ( WWW:LINK-1.0-http--link )
- OnLine resource
-
tasmax_hyras_1_*_v6-1_de.nc (daily)
(
WWW:LINK-1.0-http--download
)
The grids are written to a NetCDF file. The name of the NetCDF file is defined as follows: parameter_productname_resolution(in km)_year_version_region.nc (e.g. tasmax_hyras_1_2020_v6-1_de.nc)
- OnLine resource
-
tasmax_hyras_1_*_v6-1_de_monmean.nc (monthly)
(
WWW:LINK-1.0-http--download
)
The grids are written to a NetCDF file. The monthly data is formed as a time average from the daily data. The name of the NetCDF file is formed as follows: parameter_product_name_resolution(in km)_year_version_region_monmean.nc (e.g. tasmax_hyras_1_2020_v6-1_de_monmean.nc)
- OnLine resource
-
tasmax _hyras_1_*_v6-1_de_*.nc (multiannual)
(
WWW:LINK-1.0-http--download
)
The grids are written to a NetCDF file. The multi-year averages are formed from monthly averages (according to WMO regulations) of the corresponding time period (individual months or seasons) of the specified reference period. The name of the NetCDF file is formed as follows: parameter_product_name_resolution(in km)_climate_reference_period_version_region_averaging_period.nc (e.g. tasmax_hyras_1_1961-1990_v6-1_de_AUG.nc)
- OnLine resource
- Krähenmann S, Walter A, Brienen S, Imbery F, Matzarakis A (2018) High-resolution grids of hourly meteorological variables for Germany. Theor Appl Climatol 131:899–926. ( WWW:LINK-1.0-http--link )
- OnLine resource
- Eiselt K-U, Kaspar F, Mölg T, Krähenmann S, Posada R, Riede J (2017) Evaluation of gridding procedures for air temperature over Southern Africa. Adv Sci Res 14:163–173. ( WWW:LINK-1.0-http--link )
- OnLine resource
- WMO Guidelines on the Calculation of Climate Normals ( WWW:LINK-1.0-http--link )
- OnLine resource
-
Recommendation for raster data
(
WWW:LINK-1.0-http--link
)
DACH recommendations on uncertainties and interpretation of grid point values of station-based gridded data
- Hierarchy level
- Dataset
Conformance result
- Date (Publication)
- 2010-12-08
- Pass
- Yes
Conceptual consistency
- Name of measure
- quality_estimation
Conformance result
- Explanation
-
see Rauthe et al., 2013.
- Pass
- Yes
- Statement
-
Temperature (TAS, TASMIN, TASMAX) and relative humidity (HURS) are based on a combination of nonlinear temperature profiles with non-Euclidean residual interpolation (Krähenmann et al., 2019). The creation of the background field is based on a nonlinear regression at each time step (estimation of regional vertical profiles for 13 subregions subdivided based on weather divides, coastal distance and north-south extent). This also allows temperature inversions to be taken into account. Cold pole stations were identified separately for each time step and excluded for the profile determination. For the residual interpolation, a 5-dimensional inverse distance weighting (5D-IDW cf. Eiselt et al., 2017) is applied, which depends on the geographical longitude and latitude, altitude, coastal distance and heat island effect. For the interpolation of the minimum (TASMIN) and maximum (TASMAX) temperature, the deviations between extreme temperature and mean temperature are interpolated (non-linear regression + residual interpolation) as in TAS and then added to the mean temperature field. This ensures the consistency of the temperature fields with each other (TASMIN <= TAS <= TASMAX). For the interpolation of the relative humidity, the temperature station data was first converted into the dew point temperature and then interpolated in the same way as the temperature data and finally calculated back into the relative humidity using the temperature grid data. During the interpolation, it is ensured afterwards that a maximum humidity of 100 % is achieved.
- File identifier
- urn:wmo:md:de-dwd-cdc:ec363a6b-e628-4a9b-bde4-fdddd2db67e9 XML
- Metadata language
- Deutsch
- Character set
- UTF8
- Hierarchy level
- Dataset
- Date stamp
- 2025-07-10T06:25:30
- Metadata standard name
-
ISO 19115-2 Geographic information Metadata Part 2: Extensions for imagery and gridded data
- Metadata standard version
-
ISO 19115-2:2009-02-15
https://dwd.de
- Hours of service
-
09:00 - 16:00
- Dataset URI
-
urn:wmo:md:de-dwd-cdc:ec363a6b-e628-4a9b-bde4-fdddd2db67e9
Overviews
Spatial extent
Provided by
