 My GeoNetwork catalogue
iron
Provided by
Type of resources
Topics
Keywords
Contact for the resource
Update frequencies
-

The online map displays the location, surface extension and environmental hazard potentials for 100 mine sites for iron, copper and bauxite. The map contains standard map tools, filter functions and info boxes providing back-ground information on the OekoRess III project and the applied evaluation method. When the user clicks on each mine site displayed, a drop-down list appears that contains further site-specific information and a link for down-loading a factsheet (pdf).
-
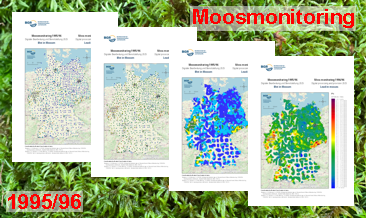
In the Federal Republic of Germany, analyses to determine the constituents of mosses were carried out at five-year intervals from 1990 to 2005 and in 2015/16 and 2020/21. The focus was on analysing heavy metals, and from 2005/06 also nitrogen. Since 2015/16, the range of substances has been expanded to include persistent organic pollutants (POPs) and microplastics. This moss monitoring is the German contribution to the European moss monitoring programme, which is coordinated by the ‘International Cooperative Programme on Effects of Air Pollution on Natural Vegetation and Crops’ (ICP Vegetation) of the Geneva Convention on Long-range Transboundary Air Pollution (CLRTAP). The German Environment Agency (Umweltbundesamt - UBA) has commissioned various institutions to carry out the individual sampling campaigns and analyse the results of the investigations, including the Federal Institute for Geosciences and Natural Resources (BGR) for moss monitoring in 1995/96. The UBA has published the results of subsequent monitoring years. They are available at https://www.umweltbundesamt.de/daten/luft/bioindikation-von-luftverunreinigungen. With 1026 sites, the 1995/96 moss monitoring is, alongside the 2000 moss monitoring, the one with the greatest sample density and, with 40 analysed elements, the one with the widest range of investigations. Although the research reports completed in 1998 and 1999 (Siewers & Herpin, 1998; Siewers, Herpin & Straßburg, 1999) contained an evaluation (brief description, statistical measures, distribution maps) of all 40 elements analysed, only the data of 12 of the analysed elements have been published to date. In addition, the raw data from the laboratories available as a result of the analyses were re-evaluated in 2007. This resulted in a series of error corrections and the analysable element spectrum was extended to 42 elements. The results of this re-evaluation have also not yet been published. The additional processing of the data using modern methods has further enhanced their value. The downloads show the distribution of iron concentrations in four different coloured dot and colour shaded contour maps. The legends of the maps can be called up either in the unit of measurement µg/g or in a unit of measurement adapted to the content range of the element shown.