 My GeoNetwork catalogue
German Aerospace Center (DLR)
Provided by
Type of resources
Available actions
Topics
Keywords
Contact for the resource
Update frequencies
Service types
-

This collection contains monthly mean tropospheric NO2 columns for Germany and surrounding areas derived from Sentinel-5P/TROPOMI Level-1B data. The Sentinel-5P tropospheric NO2 data is generated by DLR and provided in the framework of the mFUND-Project "S-VELD". The tropospheric NO2 data are vertical column densities with the unit "μmol/m2". Sentinel-5P observes Germany once per day at ~12:00 UTC and only cloud-free measurements (cloud fraction < ~0.2) are used. The Sentinel-5P tropospheric NO2 data within each month are averaged and gridded onto a regular UTM grid. The number of measurements used in the calculation of the averaged value are included in this collection as well.
-
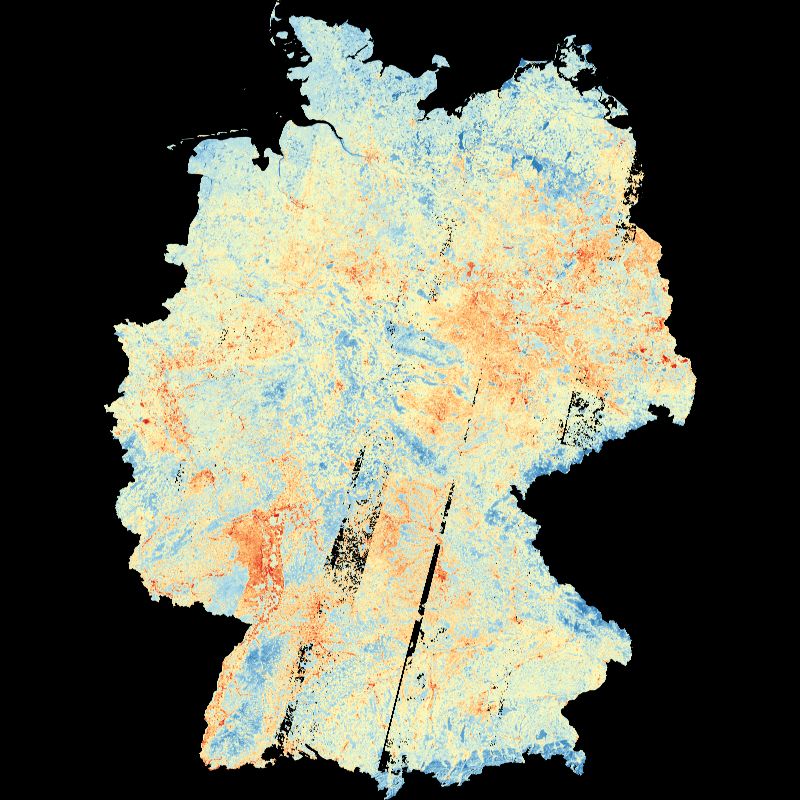
This is a high-spatial-resolution dataset aggregating cloud-free Landsat 8 and Landsat 9 Land Surface Temperature (LST) data across five consecutive summers (2021–2025). The dataset provides a temporal aggregate of the Landsat Level 2 Collection 2 product provided by the U.S. Geological Survey (USGS), indicating surface thermal patterns across Germany. The dataset includes a supplementary observation count raster, where each pixel value indicates the total number of individual, valid, cloud-free observations contributing to the final aggregated data product.
-

The Global WaterPack is a dataset containing information about open surface water cover parameters on a global scale. The water detection is derived from daily, operational MODIS datasets for every year since 2003. The negative effects of polar darkness and cloud coverage are compensated by applying interpolation processing steps. Thereby, a unique global dataset can be provided that is characterized by its high temporal resolution of one day and a spatial resolution of 250 meter. This collection includes yearly composites of the dataset with information on how often a pixel was detected as open surface water with pixel values between 0 and 365 (366 for leap years). Furthermore, a reliability layer provides information on the quality of each Global WaterPack pixel.
-
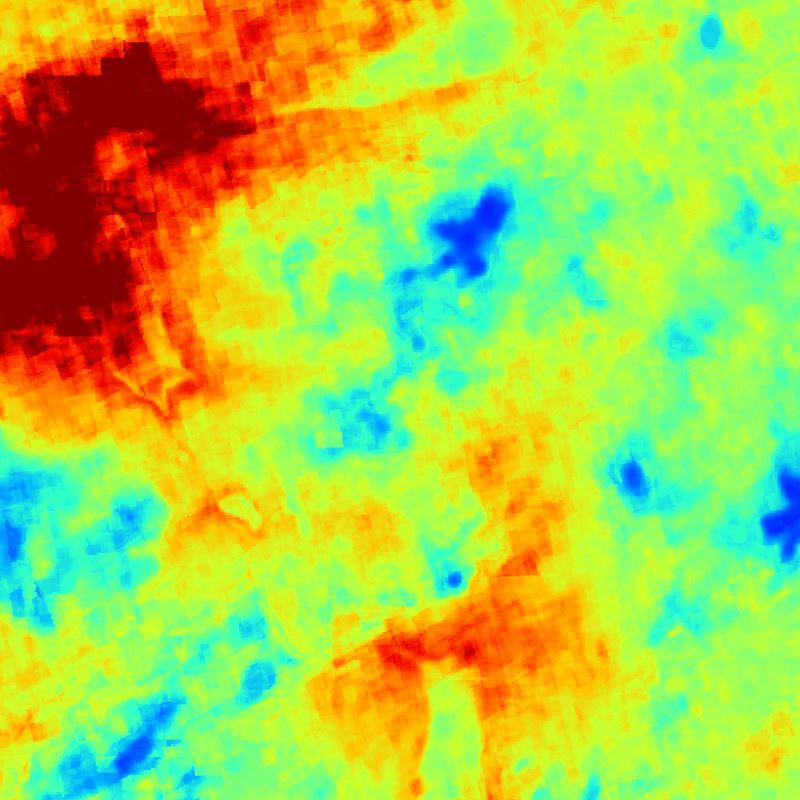
This collection contains monthly mean surface NO2 concentrations for Germany derived from Sentinel-5P/TROPOMI data. The Sentinel-5P NO2 data is generated by DLR and provided in the framework of the mFUND-Project "S-VELD". The surface NO2 data are concentrations with the unit "μg/m3". Sentinel-5P observes Germany once per day at ~12:00 UTC and only cloud-free measurements (cloud fraction less than ~0.2) are used. The Sentinel-5P surface NO2 data within each month are averaged and gridded onto a regular UTM grid. The number of measurements used in the calculation of the averaged value are included in this collection as well.
-
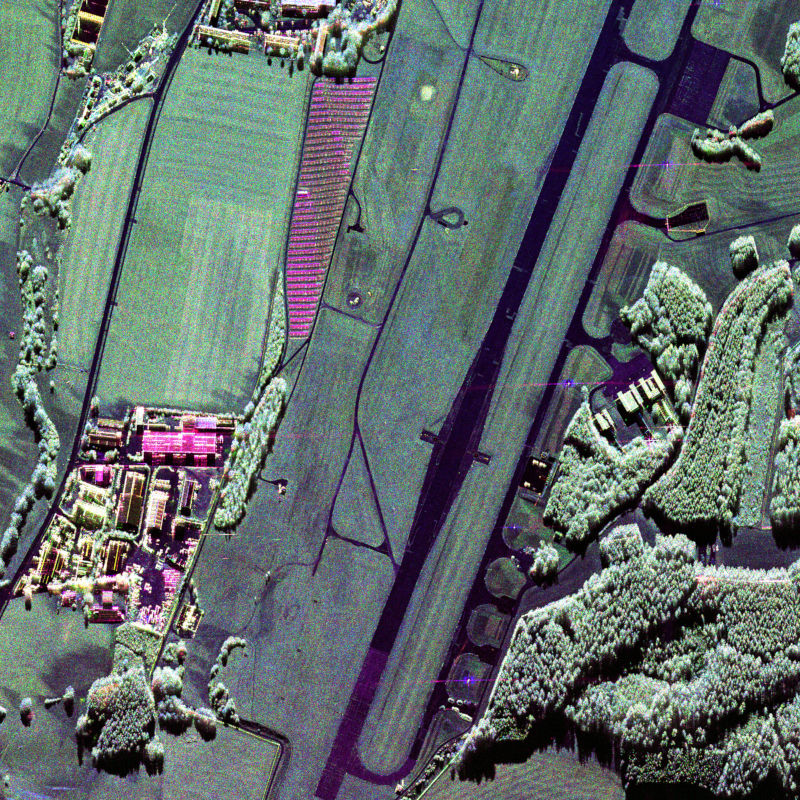
DBFSAR, "Digital Beam Forming SAR", is an airborne very-high-resolution imaging radar (Synthetic Aperture Radar) sensor presently operated by the German Aerospace Center (DLR), Microwaves and Radar Institute (HR) since November 29, 2016. It is operated on a Dornier Do-228 aircraft from altitudes of 2000 to 6000 m above ground in X-band (3 cm wavelength) only, featuring four transmit (operated sequentially) and twelve parallel receive channels. Depending on antenna deployment, it is either fully polarimetric (HH,HV,VV,VH), inetrferomtric in along- and/or across-track mode, or can be operated as a digital beamforming SAR. It has full repeat-pass capabilities. Data are processed up to three different levels: RGI (Radar Geometry Image product), INF (Interferometric product) and GTC (Geocoded and Terrain-Corrected product). The data acquisition modes are selected based on the individually planned experiments. Achieved resolutions are presently 10 cm in azimuth and 17 cm in range but will go down significantly below 10 cm in both directions.
-

The SoilSuite contains a collection of different image data products that provide information about the spectral and statistical properties of European soils and other bare surfaces such as rocks. It is created using DLR's Soil Composite Mapping Processor (ScMAP), which utilises the Sentinel-2 data archive. SCMaP is a specialised processing chain for detecting and analysing bare soils/surfaces on a large (continental) scale. Bare surface and soil pixels are selected using a combined NDVI and NBR index (PVIR2) that optimises the exclusion of photosynthetically active and non-active vegetation. The index is calculated and applied for each individual pixel. All SoilSuite products are calculated based on the available Sentinel-2 scenes recorded between January 2018 and December 2022 in Europe. The data package excludes all scenes with a cloud cover of > 80 % and a sun elevation of < 20°. The spectral composite products are calculated from the mean value after extensive removal of clouds, haze and snow effects at both scene and pixel level. The spectral data products are available at a pixel size of 20 m and contain 10 Sentinel-2 bands (B02, B03, B04, B05, B06, B07, B08, B08a, B11, B12). The SoilSuite comprises: (a) “Bare Surface Reflectance Composite – Mean” that provides the spectral properties of soils that vary due to different soil organic carbon (SOC) content, soil moisture and soil minerology. This product is often used for spectral and digital soil mapping approaches, (b) “Bare Surface Reflectance Composite - Standard deviation” informing about the spectral dynamic of bare surfaces and soils, (c) “Bare Surface Reflectance Composite – 95% Confidence” contains information about the reliability of the spectral information due to the number of valid observations per pixel, (d) “Bare Surface Statistics Product” provides the number of bare soil occurrences over the total number of valid observations (Band 1), the number of bare soil occurrences (Band 2) and the total number of valid observations (Band 3), (e) “Mask” is a product that aggregates simple landcover classes that occur during the time period between 2018 - 2022 (Sentinel-2). The three-class Mask contains bare surface occurrences (1), permanent vegetation (2) and other surfaces such as water bodies, urban areas, roads (3). Additionally, the SoilSuite provides (f) “Reflectance Composite – Mean” that represents the mean reflectance of all valid Sentinel-2 observations between 2018 – 2022 including vegetation, bare and other surfaces, and (g) “Reflectance Composite – Standard deviation”, which contains the standard deviation per band for all valid Sentinel-2 observations between 2018 – 2022.
-
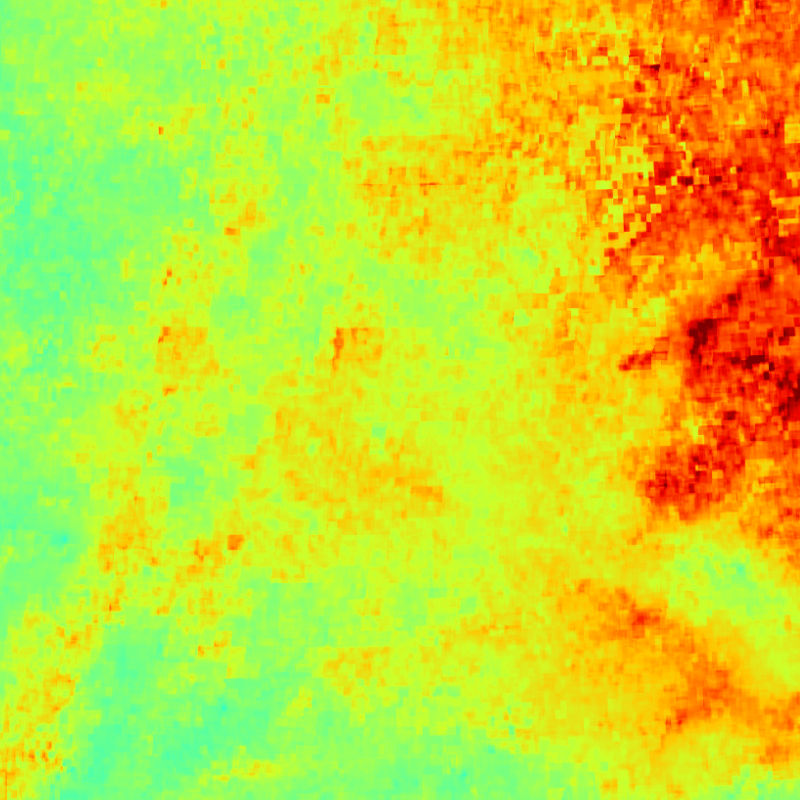
This collection contains monthly mean surface PM2.5 concentrations for Germany and parts of the surrounding countries. PM2.5 surface concentrations are derived from Aqua/MODIS and Sentinel-3A/SLSTR AOD data and provided as merged MODIS/SLSTR product. The data is generated by DLR and provided in the framework of the mFUND-Project "S-VELD". The surface PM2.5 data are concentrations with the unit "µg/m3". The satellites Aqua (NASA) and Sentinel-3 (Copernicus) observe Germany on a daily basis. PM2.5 concentrations were derived on a daily basis from the two AOD products separately and combined to a merged MODIS/SLSR surface PM2.5 product. The data within each month are averaged and gridded onto a regular UTM grid. As AOD measurements are strongly depending on cloud conditions, the spatial coverage can be limited, especially in the winter months.
-

This inventory of traffic areas in the city of Brunswick, Germany, is based on image sequences acquired during six flight campaigns at different times of the day and year in 2019 and 2020. Each aerial image is segmented by a neural network into the classes (1) Parking area, (2) Road, and (3) Access way, with the latter two classes differing in terms of their primary transportation function (mobility versus access). The individual segmentations are subsequently merged, since in addition to dedicated parking areas, those traffic areas that are regularly used for parking a motorized vehicle (e.g., at the curbside) are also to be classified as such. Furthermore, the multitemporal fusion enhances the robustness and completeness of the traffic area map (TAM). Potential applications include: urban planning, traffic modeling, and parking management. For more information about the project, the reader is referred to: https://elib.dlr.de/191145/1/Hellekes_et_al_2022_Parking_space_inventory_from_above.pdf
-
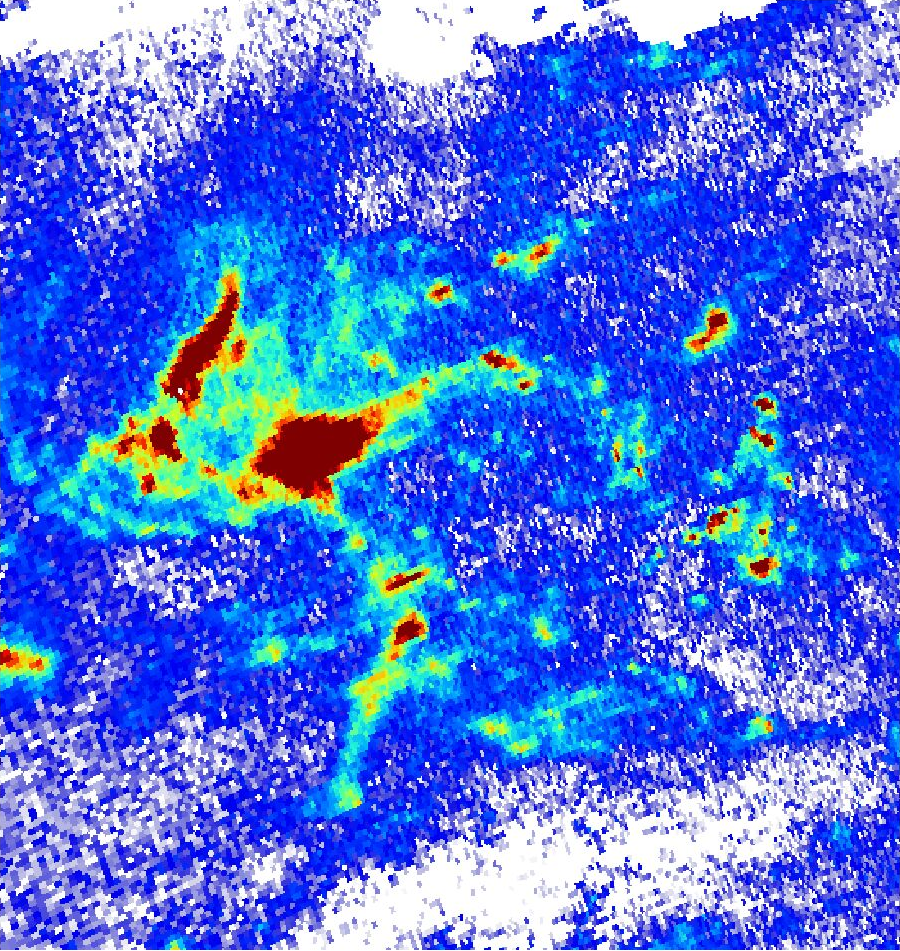
This collection contains tropospheric NO2 columns for Germany and surrounding areas derived from Sentinel-5P/TROPOMI Level-1B data. The Sentinel-5P tropospheric NO2 data is generated by DLR and provided in the framework of the mFUND-Project "S-VELD". The tropospheric NO2 data are vertical column densities with the unit "µmol/m2". Sentinel-5P observes Germany once per day at ~12:00 UTC. These daily observations are gridded onto a regular UTM grid. The day and measurement time are included in the netCDF data file. Only tropospheric NO2 data for cloud-free Sentinel-5P measurements are provided (cloud fraction < ~0.2). Sentinel-5P cloud fraction data is included in this collection as well.
-
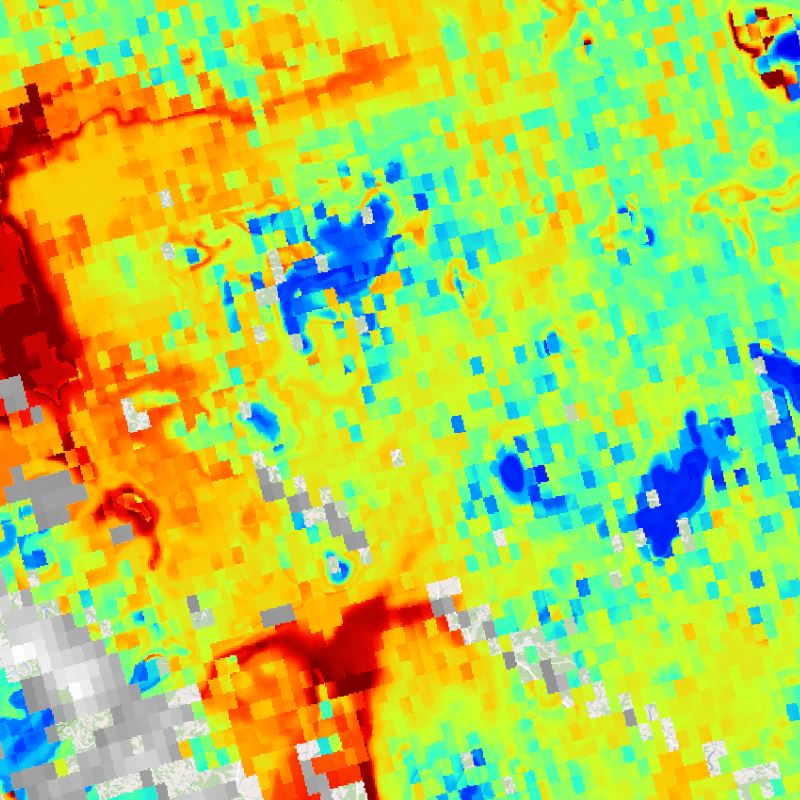
This collection contains surface NO2 concentrations for Germany derived from Sentinel-5P/TROPOMI data. The Sentinel-5P NO2 data is generated by DLR and provided in the framework of the mFUND-Project "S-VELD". The surface NO2 data are concentrations with the unit "µg/m3". Sentinel-5P observes Germany once per day at ~12:00 UTC. These daily observations are gridded onto a regular UTM grid. The day and measurement time are included in the netCDF data file. Only surface NO2 data for cloud-free Sentinel-5P measurements are provided (cloud fraction less than ~0.2). Sentinel-5P cloud fraction data is included in this collection as well.