 My GeoNetwork catalogue
geophysics
Provided by
Type of resources
Available actions
Topics
Keywords
Contact for the resource
Update frequencies
Service types
-
-
Two strong eruptions of Stromboli Volcano (38.789°N 15.213°E, 920 m) occurred on July 3rd and August 28th 2019. This data set provides the infrasound records in terms of raw pressure data in Pascal of both eruptions available at BGR’s infrasound array I26DE in Germany as well as infrasound arrays OHP and CEA in France. The publication “Using dense seismo-acoustic network to provide timely warning of the 2019 paroxysmal Stromboli eruptions” (Le Pichon et al., 2021, Scientific Reports) provides further details on this data set and its scientific application. Data format: The data are provided as ASCII files (separate file for each infrasound sensor and hour of measurement, plus a README file).
-
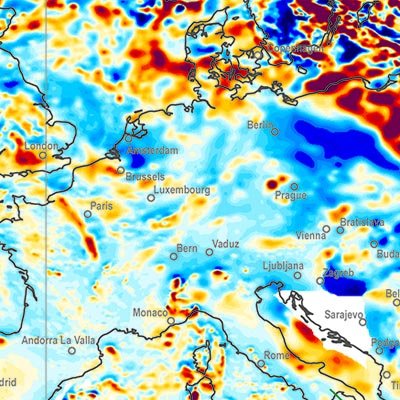
A global Earth Magnetic Anomaly Grid (EMAG2) was compiled from satellite, ship and airborne magnetic measurements. (Maus et al., 2009) Over the continents and the Arctic we made use of exisiting magnetic anomaly grids, whereas original ship and airborne trackline data were processed over the rest of the oceans, wherever available. CHAMP satellite magnetic measurements provided the magnetic field at wavelengths above 330 km. The EMAG2 grid is available at http://geomag.org and http://ngdc.noaa.gov. Directional gridding Due to the sparsity of magnetic field measurements in the southern oceans, it is necessary to interpolate the magnetic field between tracklines. Our interpolation algorithm takes the direction of the magnetic lineations into account. Tje lineations are parallel to the isochrons, which are perpendicular to the gradient of the age of teh oceanic crust. We use the age grid of Müller et al. (2008). The magnetic field ad a given grid point is computet by Least Squares Collocation from the surrounding measurements. If the point is on land, we use an isotropic correlation function with Rc = 14 km correlation length. Over the oceans we use Rc = 56 km parallel to the isochrons and Rc = 14 km in the spreading direction. Measurements seperated from the grid point by an age discontinuity or a topographic feature are excluded from the collation.
-
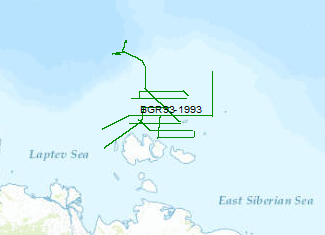
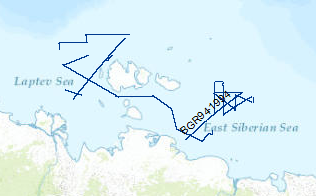
In September 1993, the Federal Institute for Geoscience and Natural Resources (BGR) has carried out in cooperation with Sevmorneftegeofizika (SMNG), Murmansk a 2D-seismic survey of the eastern part of the Laptev Sea shelf. The data format is Society of Exploration Geophysicists SEG Y. During the survey with a total length of 3189 km the 70 km wide New Siberian Basin and two other basins were mapped. In the central part of the New Siberian Basin, a Tertiary sediment thickness of more than 4 km overlying older sediments was observed. Further to the east, a large area covered by lava flows of unknown thickness was investigated. There are no indications of a propagation of real seafloor spreading into the Laptev Shelf and thus the Asian continental crust. Therefore seafloor spreading seems impossible at total spreading rates below 0.7 cm/year, at least for crust of the character which is present here.
-
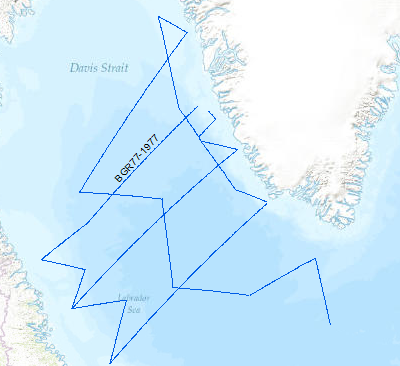
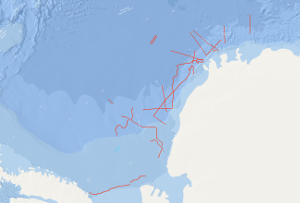
A geophysical reconnaissance survey was carried out in the Labrador Sea and Davis Strait between July and September 1977 by BGR. The data format is Society of Exploration Geophysicists SEG Y. The survey was executed on the research vessel MS Explora. The seismic, magnetic and gravity data from 5931 line-kilometers on 21 lines were recorded on magnetic tape. A 24-fold coverage technique was used with 48 seismic channels (traces), with a 2400m streamer cable, and 23.45 l airgun array. A full integrated computerized satellite navigation system (INDAS III) served as positioning system. Based on a preliminary interpretation of the seismograms, the Labrador Sea was devided into an eastern (Greenland) and western (Canadian) area, seperated by the Mid Labrador Ridge. Within the eastern part of the Labrador Sea the Pre-Cenozoic sediments show three distinct layers, traceable over the entire Greenland area of the sea. In the Cenozoic layer olisthostromes occur. The highest apparent velocity determined from sonobuoy data was 9.26 km/sec. The calculated refractor lies at a depth of approximately 13 km. The seismic section from the sediments on the Canadian side of the Labrador Sea show a uniform series of thick sediments below the Cenozoic cover. The highly disturbed basement is often masked by the multiple reflections from the seafloor. Statements about the nature and structure of the basement can only be made after processing data.
-
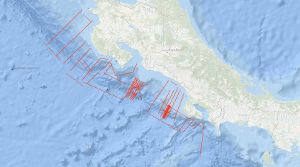
Between 08.11.1999 and 02.12.1999 the active convergent margin off Costa Rica was investigated using the S/V Professor Polshkov. The cruise had three scientific targets. Several seismic profiles in the dip-direction of the subduction zone were acquired to map the general variability of the accretionary wedge. Near the Jaco Scarp, a dense net of seismic profiles using a smaller seismic source should deliver information about the amount of gas hydrates within the shallow sub-surface. In an area of this wedge south of the Quepos Plateau densely spaced seismic lines were measured to prepare an ODP campaign (which was finished in 2011 as IODP Expedition 334).
-
This data set builds upon the broadband detection lists of the International Monitoring System (IMS)’s infrasound stations. The infrasound data of these stations are regularly (re-)processed at the German National Data Centre at BGR (e.g., Ceranna et al., 2019; https://doi.org/10.1007/978-3-319-75140-5_13) using the Progressive Multi-Channel Correlation (PMCC) array processing method (Cansi, 1995; https://doi.org/10.1029/95GL00468). The latest reprocessing with 26 one-third octave spaced frequency bands in the IMS band of interest (0.01 to 4 Hz) included all 53 stations that were certified within the period 2003 to 2020. Based on the resulting broadband detection lists, this data set expands on former analyses of the coherent ambient noise. For each station with a data availability of at least one year (by the end of 2020), monthly reference histograms for the detection parameters back azimuth, apparent speed, and root-mean-squared amplitude are provided. The histograms provide a means to determine the deviation from nominal monthly behaviour and thus enable assessing the plausibility of detections and potential anomalies – without determining their cause – in the detected parameters. Overall, these quality metrics will be, among other applications, a useful supplement to the open-access IMS infrasound data products provided by Hupe et al., which are also available in BGR’s product centre. Further details of the reference histograms are described in the following publication by Kristoffersen et al.: "Updated global reference models of broadband coherent infrasound signals for atmospheric studies and civilian applications" (https://doi.org/10.1029/2022EA002222).
-
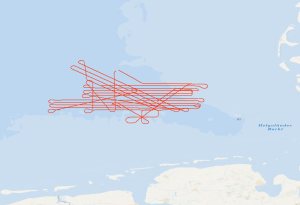
Regarding the use of renewable energy and the reduction of greenhouse-gas emissions, the geological storage of fluids is of particular interest. Therefore, reservoir and barrier formations in the German North Sea come into focus. Due to the widespread distribution of storage and barrier rocks at suitable depths and in combination with a relatively low tectonic overprint, the West Schleswig Block region in the German North Sea shows a high prospectivity for CO2 storage. By means of this high-resolution 2D reflection seismic survey, we want to investigate the potential impairment of geological barriers at the top of geological storage formations (i.e. claystones/mudstones and salt of the Upper Buntsandstein, mudstone dominated formations of the Lower Cretaceous and of the Tertiary). The seismic acquisition setup with a 2400 m active streamer cable with 384 channels will allow a precise image of near-surface structures, such as Quaternary channels, seismic pipe structures, chimneys, polygonal fault systems and crestal faults. In the time period between Nov. 13th and Nov. 24th we acquired 32 lines 2D seismic reflection data (about 1500 km in total) in combination with gravity data, multibeam data and sediment echosounder data. The seismic data resolve the sediments from the seafloor down to the base of the Zechstein. With the acquired data, the sediments of the Mesozoic and Cenozoic up to the seafloor (2-3 seconds of twoway-traveltime) will be imaged in high-resolution for the first time. The imaged fault systems will be investigated regarding their ability to build seal bypass systems. In addition, we acquired seismic data across the Figge Maar blowout crater and we intend to compare these data with the seismic data from the West Schleswig Block.
-
On the F.S. POLARSTERN cruise ANT-IV/3 (6th December, 1985 - 13th March, 1986) multichannel seismic measurements were carried out in parallel with magnetic and gravimetric measurements on 33 lines with a total length of 6,263 km. 3,350 km of the multichannel seismic lines have been processed aboard. The geophysical studies were designed to investigate the structure and geological development of the Weddell Sea continental margin from meridians zero to 60°W, and to define suitable and safe drilling locations for Leg 113 of the Ocean Drilling Program. The main results of the geophysical studies are: (1) The discovery of an approximately N50°E trending failed drift basin, following the trend of a negative magnetic anomaly and a positive gravity anomaly. (2) The discovery of two extensive wedge-shaped and symmetric basement units around a failed drift basin between longitudes 40°W and 20°W. The seismic characteristics, i.e. seismic velocities of 4 km/s and an internally divergent pattern of reflectors suggest that both wedges are formed from extrusive/intrusive volcanic rocks. (3) The confirmation of a major plate tectonic boundary trending approximately N80°E to N60°E, i.e. the EXPLORA-ANDENES escarpment. (4) The confirmation of a glaciogenic progradational wedge beneath the shelf of the Weddell Sea Embayment, made up of several thousand metres of sediments. (5) The definition of 13 suitable and safe drilling locations for ODP-Leg 113.
-
On the M/V Akademic Nemchinow multichannel seismic measurements were carried out on 34 lines with a total length of 4,000 km. The area covered was the Laptev Sea. The data format is Society of Exploration Geophysicists SEG Y.