 My GeoNetwork catalogue
urban
Provided by
Type of resources
Topics
Keywords
Contact for the resource
Update frequencies
-
This dataset aims to provide high-quality, high-resolution, long-term information on CO2 and CO concentrations and meteorology in German metropolitan areas as a basis for various research applications. Already existing applications of this data include the optimization of urban sensor networks for CO2 monitoring and verification, the investigation of satellite observation strategies for CO2 and CO, as well as comparisons with in-situ measurement data. This dataset contains 1km resolved CO2 and CO concentration fields as well as meteorology for the full year of 2018 in 5 metropolitan regions in Germany (Rhine-Neckar, Berlin, Rhine-Ruhr, Nuremberg, Munich). These domains are embedded in the Germany domain at 5km resolution and the Europe domain at 15km resolution. There are two simulations available using two different WRF-Chem v4.3.3 (https://github.com/wrf-model/WRF) configurations: One using Mellor-Yamada-Janjic as Boundary Layer scheme as well as Monin-Obukhov-Janjic as Surface Layer scheme and the other using Yonsei University as Boundary Layer scheme as well as MM5 as Surface Layer scheme. High resolution anthropogenic emission data as input for the model was prepared by TNO, the Netherlands following the description in Super et al. (2020). Biogenic emissions are from two versions of VPRM. VPRM v1 was prepared by J. Marshall (personal communication) and VPRM v2 was prepared using pyVPRM (Glauch et al, 2025). Background concentration data is from CAMS (GHG short-term forecast; experiment ID gqpe — IFS cycle CY43R1; Diamantakis and Agusti-Panareda, 2017, and Agusti-Panareda et al., 2017). Preparatory sensitivity studies were published in Pilz et al. 2026. More information and easy access to another version of this data can be found at https://atmo-iup-uhei.github.io/macro-2018/
-
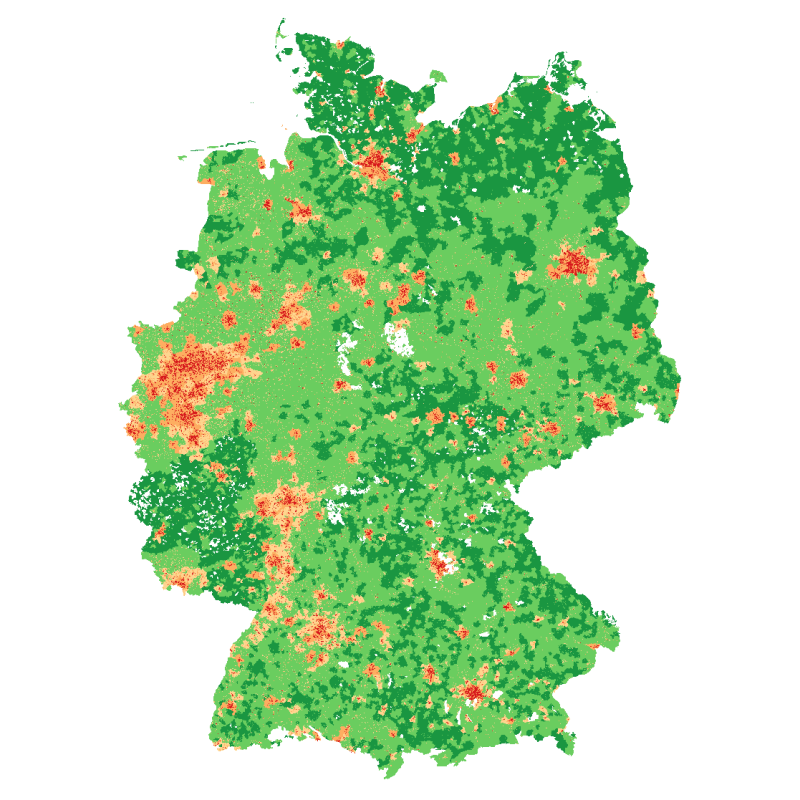
The degree of urbanization provides urbanization level information at 100x100 meter grids for Germany. It is based on population numbers, building density and the share of building types. It is provided as a continuous percentage value representing the probability of the degree of urbanization, as well as five discrete values representing classes of the degree of urbanization: definitely ‘urban’, probably ‘urban’, area of uncertainty, probably ‘rural’, definitely ‘rural’.
-
This dataset contains the results of nine simulations performed for the validation of the snow cover and precipitation scheme used in the microscale, obstacle-resolving model MITRAS v3.0 (Salim et al., 2013; Schluenzen et al., 2018), v3.1 (Ferner et al. 2023), and v3.3 (Samsel et al. 2025, in review). The model domain extends 240 m x 210 m horizontally and includes orography, slanted roofs, obstacle corners and different surface cover classes. The simulations were performed using different model versions, initial temperatures, precipitation and processing modes. The simulations cover 62 minutes model time, starting at 7:30 am model time, with a temporal resolution of 5 seconds or 5 minutes. This dataset contains a selection of output variables, control variables are not included. The file names of the data sets are composed as follows. {temperature}_{intensity}_{model version}_{comment}_{case ID}.nc There are 3 intensities for temperature: low, medium, high Associated values are: T_low = 272 K, T_medium = 280 K, T_high = 288 K Three versions are considered: v3p0 = MITRAS v3.0 (initial version), v3p1 = MITRAS v3.1 (inclusion of warm rain scheme), v3p3 = MITRAS v3.3 (inclusion of winter parameterisation scheme) Special cases are 'noparallel', where the simulation was performed with the parallelisation mode switched off, and 'noprecip', where no precipitation is initialised. Example: T_high_v3p1_Hwr.nc
-
This experiment contains sensitivity test results (Ferner et al. 2023) of 11 simulations with the microscale, obstacle-resolving model MITRAS v 3.1 (Salim et al., 2018; Schluenzen et al., 2018) for a domain of 1.6 x 1.8 km² around Hamburg City Hall in Hamburg. The domain contains various street configurations, open spaces, water surfaces, orography and building heights. The simulations were performed with different initial wind speeds, rain amounts, wind directions, and domain configurations. The simulations cover 1:40 hours, starting at 7:30 LST (LST refers to Local Solar Time), with a temporal resolution of 10, 1 or 5 minutes. This experiment contains a selection of output variables, control variables are not included. The file names of the data sets are composed as follows. {precipitation}_{intensity}_{windspeed}_ {intensity}_{winddirection}_{value}_{case ID}.nc There are 3 intensities: low, medium, high Associated values are these: pr_low = 0.5 mm, pr_medium =0.9 mm, pr_high = 1.7 mm (after 10 minutes) ff_low = 2 m/s, ff_medium = 4 m/s, ff_high = 4 m/s Example: pr_medium_ff_low_dd_270_ML27.nc
-
This experiment contains the model output of a simulation by the microscale obstacle resolving model MITRAS (Salim et al., 2018; Schluenzen et al., 2018, model version MITRAS ver2 rev471a5b5). MITRAS can resolve small scale atmospheric processes in urban areas and is maintained by the MEMI working group of the University of Hamburg (https://www.mi.uni-hamburg.de/en/arbeitsgruppen/memi/). The aim of this simulation was to create an obstacle resolving model (ORM) dataset to test the suitability of the newly established ATMODAT standard (Ganske et al., 2021) in standardising ORM results, as a part of the AtMoDat project (https://www.atmodat.de/). The simulation results show the distribution of passive tracer and wind field within the city center of Hamburg, Germany. Emitted tracer represent particulate matter (pm10), emitted from green spaces in the city center. Only dynamical effects are calculated in this simulation. The model domain covers an area of 2000x2000x8000 m, using a non-equidistant, cartesian grid with an spatial resolution of 2.5 m in horizontal and 5 m in vertical direction with increasing grid cell size towards the model boundaries. Information about the location and height of the obstacles are provided within the dataset. The model domain is based on the study of Hefny Salim et al., (2015). The simulation covers one hour model time, starting at 4 am model time, with a temporal resolution of 5 minutes. This dataset contains a selection of output variables; control variables are not included. Model Settings: passive tracer emission; no diurnal cycle; stable stratification; low wind speed (u,v = 3 m/s, 0 m/s). This dataset has been standardized according to the ATMODAT Standard (v3.0) (Ganske et al., 2021). The AtMoDat project was funded in the framework of \"Forschungsvorhaben zur Entwicklung und Erprobung von Kurationskriterien und Qualitaetsstandards von Forschungsdaten\" by the German Federal Ministry of Education and Research (BMBF; FKZ: 16QK02C). This data was prepared in the project AtMoDat and acts as an example dataset for standardisation of microscale model data using the ATMODAT standard.