 My GeoNetwork catalogue
Sentinel-2
Provided by
Type of resources
Available actions
Topics
Keywords
Contact for the resource
Update frequencies
Service types
-
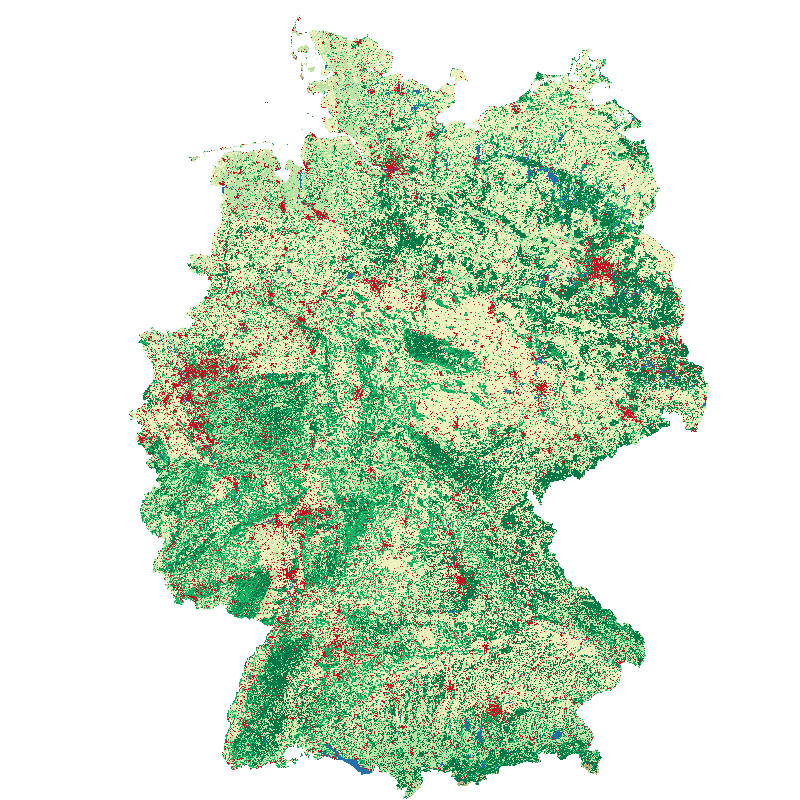
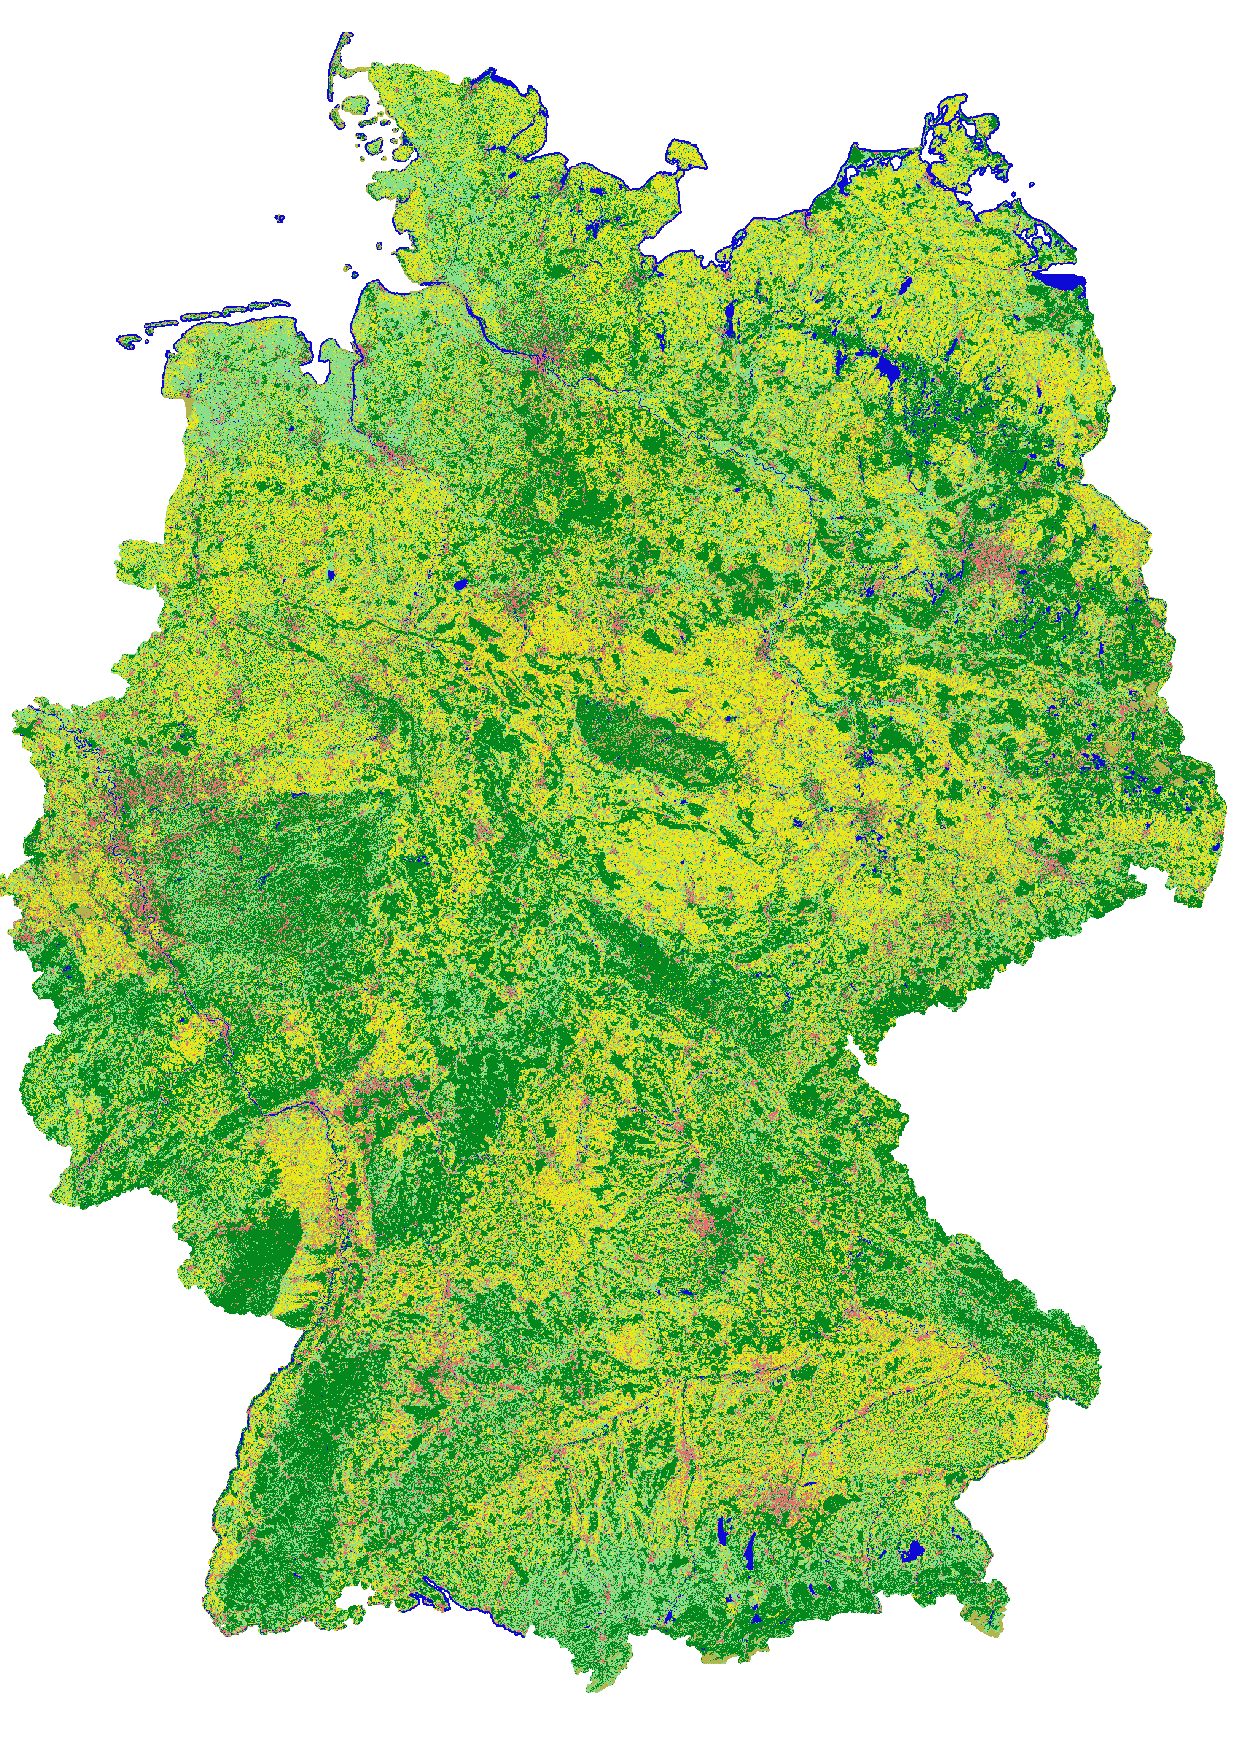
This land cover classification of Germany was created using Sentinel-2 imagery from the years 2015 to 2017 and LUCAS 2015 in-situ reference data (https://ec.europa.eu/eurostat/web/lucas). It contains seven land cover types: (1) artificial land, (2) open soil, (3) high seasonal vegetation, (4) high perennial vegetation, (5) low seasonal vegetation, (6) low perennial vegetation and (7) water with a spatial resolution of 10m x 10m. For further information, please see the following publication: https://doi.org/10.1016/j.jag.2020.102065
-
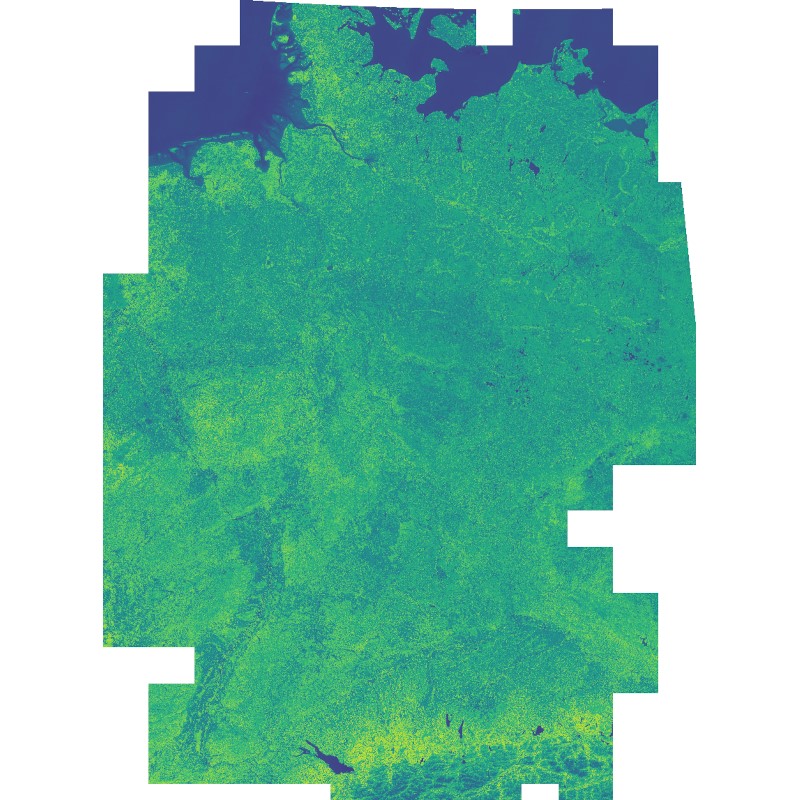
This dataset includes the normalized difference vegetation index (NDVI) derived from Sentinel-2 imagery. Using the Google Earth Engine, all granules with a cloud cover below 60% were used as input. Cloudy pixels (referring to quality layer QA60) were masked as well. Eventually, a median mosaic was composed over the whole observation period. It was also used as input for a land cover classification (see: Land Cover DE - Sentinel-2 - Germany, 2015).
-

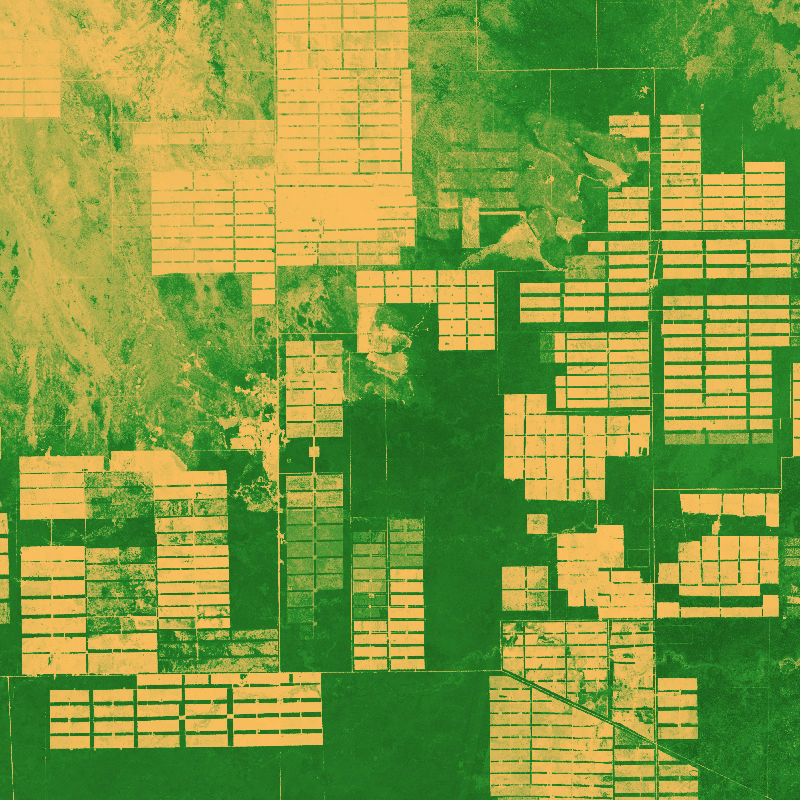
The Sentinel-2 fractional vegetation cover (fCover) product for the Netherlands was produced as part of the NextGEOSS project at the German Aerospace Center (DLR). The goal is to derive abundance maps from atmospherically corrected Sentinel-2 multispectral images for: photosynthetically active vegetation (PV); and for combined non-photosynthetically active vegetation (NPV) and bare soil (BS). The fCover product for the Netherlands has been generated by processing 10 cloud-free Sentinel-2 tiles which covered the country on 8 September 2016. The map has a spatial resolution of 60m x 60m. The Sentinel-2 scene classification layer was used to ensure that the spectral unmixing was only performed on areas of vegetation or soil. The abundance maps were made by performing MESMA unmixing on each pixel from an endmember library of PV and combined NPV + BS spectra. The purest pixels in a scene, called endmembers, were extracted using the Spatial-Spectral Endmember Extraction (SSEE) approach. The PV and NPV+BS endmembers were classified with a random forest approach and selected to form the spectral library. The spectral library was used in the µMESMA unmixing to get the PV and NPV+BS abundances.
-
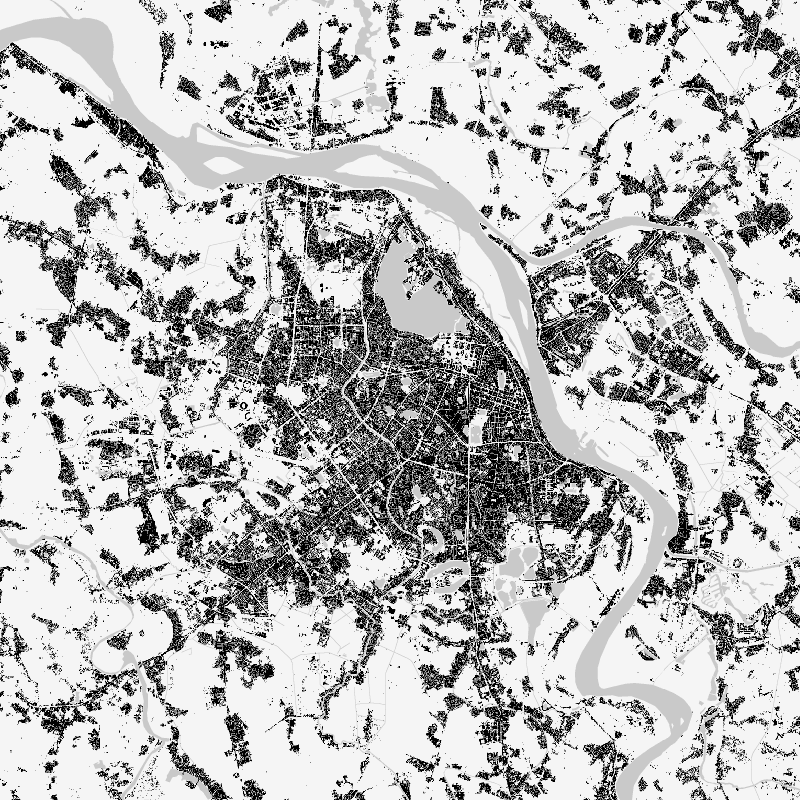
The World Settlement Footprint (WSF) 2019 is a 10m resolution binary mask outlining the extent of human settlements globally derived by means of 2019 multitemporal Sentinel-1 (S1) and Sentinel-2 (S2) imagery. Based on the hypothesis that settlements generally show a more stable behavior with respect to most land-cover classes, temporal statistics are calculated for both S1- and S2-based indices. In particular, a comprehensive analysis has been performed by exploiting a number of reference building outlines to identify the most suitable set of temporal features (ultimately including 6 from S1 and 25 from S2). Training points for the settlement and non-settlement class are then generated by thresholding specific features, which varies depending on the 30 climate types of the well-established Köppen Geiger scheme. Next, binary classification based on Random Forest is applied and, finally, a dedicated post-processing is performed where ancillary datasets are employed to further reduce omission and commission errors. Here, the whole classification process has been entirely carried out within the Google Earth Engine platform. To assess the high accuracy and reliability of the WSF2019, two independent crowd-sourcing-based validation exercises have been carried out with the support of Google and Mapswipe, respectively, where overall 1M reference labels have been collected based photointerpretation of very high-resolution optical imagery.
-

This vector dataset is based on a 10 m resolution raster dataset that shows forest canopy cover loss (FCCL) in Germany at a monthly resolution from September 2017 to September 2024. Results at pixel level were aggregated at municipality, district, and federal state level. For the results at administrative level we differentiate between deciduous and coniferous forests. We use the stocked area map 2018 (Langner et al. 2022, https://doi.org/10.3220/DATA20221205151218 ) as a reference forest mask. We differentiate between deciduous and coniferous forests by intersecting the stocked area map with a tree species map (Blickensdoerfer et al. 2024). Pixels of the classes birch, beech, oak, alder, deciduous trees with long lifespan and deciduous trees with short lifespan were classified as deciduous forest and pixels of the classes Douglas fir, spruce, pine, larch and fir as coniferous forest. The coverage of the two datasets is not identical, which is why a few areas of the forest reference map remained unclassified. These were filled with the dominant leaf type map of the Copernicus Land Monitoring Service (CLMS 2025). Therefore, the vector data at administrative level contains information about unclassified forest areas and the total forest area as the sum of deciduous, coniferous, and unclassified forests. The FCCL confidence at pixel level is lowest at the end of the time series because the number of repeated threshold exceedance is used as a criterion to record forest canopy cover losses. Therefore, we excluded July 2024 through September 2024 from the annual and overall statistics and summarized the respective FCCL as additional attribute. The dataset is a fully reprocessed continuation of the assessment in Thonfeld et al. (2022).
-

This raster dataset shows forest canopy cover loss (FCCL) in Germany at a monthly resolution from September 2017 to October 2025. It is similar to the product developed by Thonfeld et al. (2022) but was fully reprocessed and updated to reveal the most recent forest disturbance dynamics (Thonfeld et al. 2026). The combination of Sentinel-2A/B and Landsat-8/9 data allows for a high temporal resolution while the pixel size of the product is 10 m. The results are clipped to the stocked area 2018 mapped by the Thünen-Institute (Langner et al. 2022, https://doi.org/10.3220/DATA20221205151218). The dataset contains predominantly larger canopy openings resulting from different drivers but also larger clusters of standing deadwood. FCCL can result from abiotic (e.g. wind, fire, drought, hail) drivers, biotic (e.g. insects, funghi) drivers or a combination of both as well as from sanitary and salvage logging and planned harvest. The first version with canopy cover losses from January 2018 - April 2021 (Thonfeld et al. 2022) can be accessed here: https://geoservice.dlr.de/web/datasets/tccl.
-
The dataset is based on an analysis combining Sentinel-1 (SAR), -2 (Multispectral) and GEDI (Global Ecosystem Dynamics Investigation, LiDAR) data to model vegetation structure information. The derived products show high-spatial resolution maps (10 m) of total canopy cover (cover density in %), Foliage height diversity (Fhd) index in meter, Plant area index (Pai) in meter and canopy height (rh95) in meter.
-

The PolarLakes dataset provides bi-weekly observations of supraglacial lakes on Antarctic ice shelves, utilizing imagery from Sentinel-2 and Sentinel-1 to address time series gaps caused by frequent cloud cover. These observations detect the extents of supraglacial lakes with a U-Net model for every two weeks from November to March, with each sensor operating independently before the data is merged. The resulting bi-weekly product reflects the maximum lake extents for the first and second halves of each month. When combined for an entire season, the dataset consolidates all bi-weekly records over these five months, allowing for analysis of the maximum lake extent per season and the frequency of lake formation, which can occur up to ten times (5 months á two weeks). The year indicated in the dataset corresponds to January of the melt season, as this month typically experiences the highest melt rates (e.g., 2023 refers to the season from November 2022 to March 2023). The aggregation of all annual datasets creates a recurrence layer that illustrates the frequency of lake presence throughout the entire observation period, which spans from 2014 to 2024, depending on satellite data availability for each ice shelf. The PolarLakes dataset provides valuable insights into the dynamics of supraglacial lakes and serves as a crucial resource for hydrological and climate modeling.
-
This landcover map was produced with a classification method developed in the project incora (Inwertsetzung von Copernicus-Daten für die Raumbeobachtung, mFUND Förderkennzeichen: 19F2079C) in cooperation with ILS (Institut für Landes- und Stadtentwicklungsforschung gGmbH) and BBSR (Bundesinstitut für Bau-, Stadt- und Raumforschung) funded by BMVI (Federal Ministry of Transport and Digital Infrastructure). The goal of incora is an analysis of settlement and infrastructure dynamics in Germany based on Copernicus Sentinel data. Even though the project is concluded, the annual land cover classification product is continuously generated. This classification is based on a time-series of monthly averaged, atmospherically corrected Sentinel-2 tiles (MAJA L3A-WASP: https://geoservice.dlr.de/web/maps/sentinel2:l3a:wasp; DLR (2019): Sentinel-2 MSI - Level 2A (MAJA-Tiles)- Germany). It consists of the following landcover classes: 10: forest 20: low vegetation 30: water 40: built-up 50: bare soil 60: agriculture Potential training and validation areas were automatically extracted using spectral indices and their temporal variability from the Sentinel-2 data itself as well as the following auxiliary datasets: - OpenStreetMap (Map data copyrighted OpenStreetMap contributors and available from htttps://www.openstreetmap.org) - Copernicus HRL Imperviousness Status Map 2018 (© European Union, Copernicus Land Monitoring Service 2018, European Environment Agency (EEA)) - S2GLC Land Cover Map of Europe 2017 (Malinowski et al. 2020: Automated Production of Land Cover/Use Map of Europe Based on Sentinel-2 Imagery. Remote Sens. 2020, 12(21), 3523; https://doi.org/10.3390/rs12213523) - Germany NUTS administrative areas 1:250000 (© GeoBasis-DE / BKG 2020 / dl-de/by-2-0 / https://gdz.bkg.bund.de/index.php/default/nuts-gebiete-1-250-000-stand-31-12-nuts250-31-12.html) - Contains modified Copernicus Sentinel data (2020), processed by mundialis Processing was performed for blocks of federal states and individual maps were mosaicked afterwards. For each class 100,000 pixels from the potential training areas were extracted as training data. An exemplary validation of the classification results was perfomed for the federal state of North Rhine-Westphalia as its open data policy allows for direct access to official data to be used as reference. Rules to convert relevant ATKIS Basis-DLM object classes to the incora nomenclature were defined. Subsequently, 5.000 reference points were randomly sampled and their classification in each case visually examined and, if necessary, revised to obtain a robust reference data set. The comparison of this reference data set with the incora classification yielded the following results: overall accuracy: 83.5% class: user's accuracy / producer's accuracy (number of reference points n) forest: 90.6% / 91.9% (1410) low vegetation: 69.2% / 82.8% (844) water: 97.0% / 94.2% (69) built-up: 96.5% / 97.4% (983) bare soil: 8.5% / 68.3% (41) agriculture: 96.6% / 68.4% (1653) Compared to the previous years, the overall accuracy and accuracies of some classes is reduced. 2021 was a rather cloudy year in Germany, which means that the detection of agricultural areas is hampered as it is based on the variance of the NDVI throughout the year. With fewer cloud-free images available, the NDVI variance is not fully covered and as no adaptations have been applied to the algorithm, agricultural fields may get classified as low vegetation or bare soil more often. Another reason for lower classification accuracy is the significant damage that occured to forest areas due to storm and bark beetle. The validation dataset was generated based on aerial imagery from the years 2018/2019 which and is slowly becoming obsolete. An up-to-date validation dataset will be applied. Incora report with details on methods and results: pending
-

The Tree Species Germany product provides a map of dominant tree species across Germany for the year 2022 at a spatial resolution of 10 meters. The map depicts the distribution of ten tree species groups derived from multi-temporal optical Sentinel-2 data, radar data from Sentinel-1, and a digital elevation model. The input features explicitly incorporate phenological information to capture seasonal vegetation dynamics relevant for species discrimination. A total of over 80,000 training and test samples were compiled from publicly accessible sources, including urban tree inventories, Google Earth Pro, Google Street View, and field observations. The final classification was generated using an XGBoost machine learning algorithm. The Tree Species Germany product achieves an overall F1-score of 0.89. For the dominant species pine, spruce, beech, and oak, class-wise F1-scores range from 0.76 to 0.98, while F1-scores for other widespread species such as birch, alder, larch, Douglas fir, and fir range from 0.88 to 0.96. The product provides a consistent, high-resolution, and up-to-date representation of tree species distribution across Germany. Its transferable, cost-efficient, and repeatable methodology enables reliable large-scale forest monitoring and offers a valuable basis for assessing spatial patterns and temporal changes in forest composition in the context of ongoing climatic and environmental dynamics.