 My GeoNetwork catalogue
imageryBaseMapsEarthCover
Provided by
Type of resources
Available actions
Topics
Keywords
Contact for the resource
Update frequencies
-

-
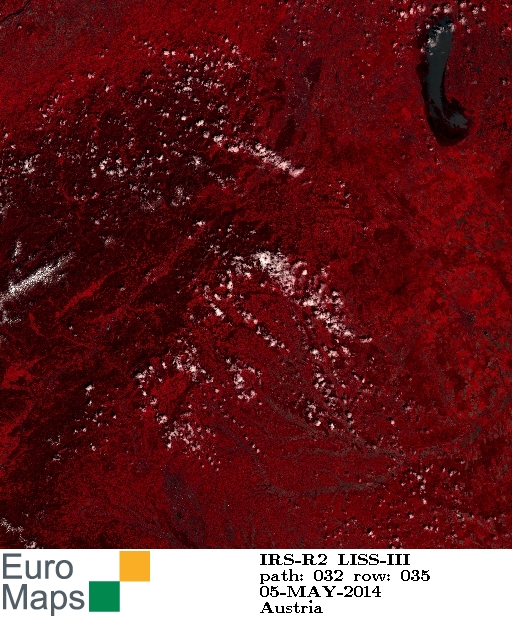
Indian Remote Sensing satellites (IRS) are a series of Earth Observation satellites, built, launched and maintained by Indian Space Research Organisation. The IRS series provides many remote sensing services to India and international ground stations. IRS LISS-III data are well suited for agricultural and forestry monitoring tasks.
-
The EnMAP HSI L2A dataset collection comprises a standardized, consistent, systematically processed, and cloud-native level-2A dataset series for the entire mission. It is especially useful for big data or time series analyses. The dataset is processed with the atmospheric correction over land processor and is provided in cloud-optimized GeoTIFF format for direct access and download. The metadata follows the CEOS Analysis Ready Data (CEOS-ARD) framework. The database is constantly updated with newly acquired data. The Environmental Mapping and Analysis Program (EnMAP) is a German hyperspectral satellite mission that monitors and characterizes Earth’s environment on a global scale. EnMAP delivers accurate data that provides information on the status and evolution of terrestrial and aquatic ecosystems, supporting environmental monitoring, management, and decision-making. For more information, please see the mission website: https://www.enmap.org/mission/
-
Digitale Orthophotos flächendeckend für das Gebiet der Stadt Hamm, in belaubtem Zustand, im Blattschnitt der DGK
-
Digitale Orthophotos flächendeckend für das Gebiet der Stadt Hamm, in belaubtem Zustand, im Blattschnitt der DGK
-
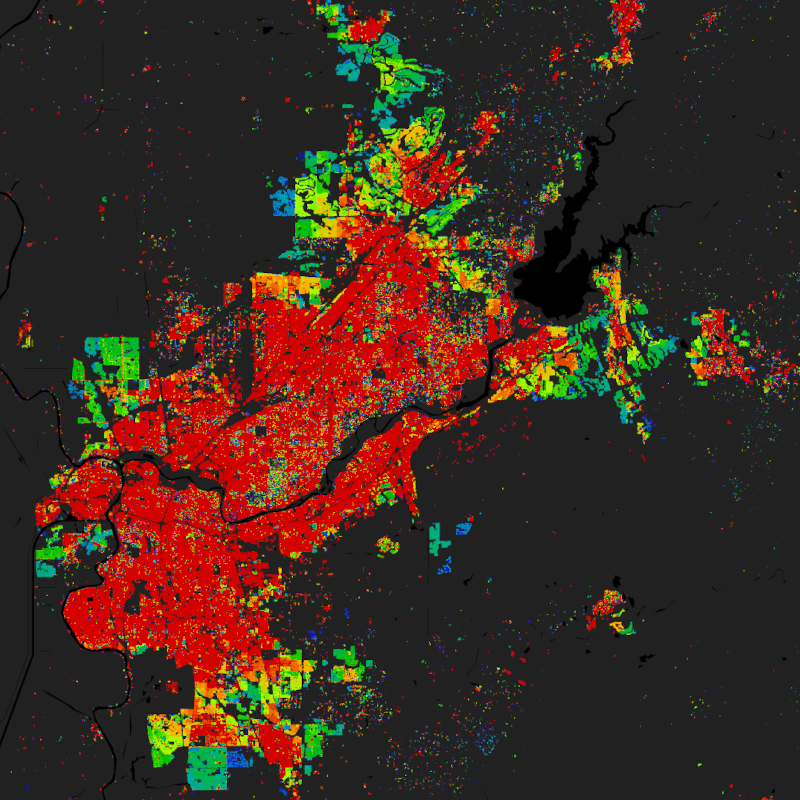
The World Settlement Footprint (WSF) 2019 is a 10m resolution binary mask outlining the extent of human settlements globally derived by means of 2019 multitemporal Sentinel-1 (S1) and Sentinel-2 (S2) imagery. Based on the hypothesis that settlements generally show a more stable behavior with respect to most land-cover classes, temporal statistics are calculated for both S1- and S2-based indices. In particular, a comprehensive analysis has been performed by exploiting a number of reference building outlines to identify the most suitable set of temporal features (ultimately including 6 from S1 and 25 from S2). Training points for the settlement and non-settlement class are then generated by thresholding specific features, which varies depending on the 30 climate types of the well-established Köppen Geiger scheme. Next, binary classification based on Random Forest is applied and, finally, a dedicated post-processing is performed where ancillary datasets are employed to further reduce omission and commission errors. Here, the whole classification process has been entirely carried out within the Google Earth Engine platform. To assess the high accuracy and reliability of the WSF2019, two independent crowd-sourcing-based validation exercises have been carried out with the support of Google and Mapswipe, respectively, where overall 1M reference labels have been collected based photointerpretation of very high-resolution optical imagery. Starting backwards from the year 2015 - for which the WSF2015 is used as a reference - settlement and non-settlement training samples for the given target year t are iteratively extracted by applying morphological filtering to the settlement mask derived for the year t+1, as well as excluding potentially mislabeled samples by adaptively thresholding the temporal mean NDBI, MNDWI and NDVI. Finally, binary Random Forest classification in performed. To quantitatively assess the high accuracy and reliability of the dataset, an extensive campaign based on crowdsourcing photointerpretation of very high-resolution airborne and satellite historical imagery has been performed with the support of Google. In particular, for the years 1990, 1995, 2000, 2005, 2010 and 2015, ~200K reference cells of 30x30m size distributed over 100 sites around the world have been labelled, hence summing up to overall ~1.2M validation samples. It is worth noting that past Landsat-5/7 availability considerably varies across the world and over time. Independently from the implemented approach, this might then result in a lower quality of the final product where few/no scenes have been collected. Accordingly, to provide the users with a suitable and intuitive measure that accounts for the goodness of the Landsat imagery, we conceived the Input Data Consistency (IDC) score, which ranges from 6 to 1 with: 6) very good; 5) good; 4) fair; 3) moderate; 2) low; 1) very low. The IDC score is available on a yearly basis between 1985 and 2015 and supports a proper interpretation of the WSF evolution product. The WSF evolution and IDC score datasets are organized in 5138 GeoTIFF files (EPSG4326 projection) each one referring to a portion of 2x2 degree size (~222x222km) on the ground. WSF evolution values range between 1985 and 2015 corresponding to the estimated year of settlement detection, whereas 0 is no data. A comprehensive publication with all technical details and accuracy figures is currently being finalized. For the time being, please refer to Marconcini et al,. 2021.
-
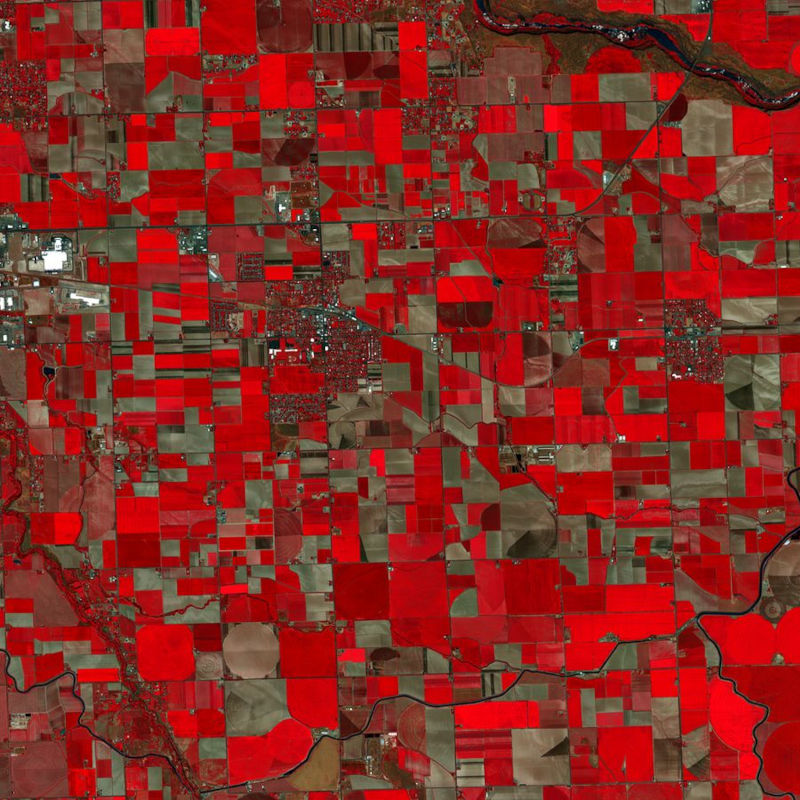
The PlanetScope satellite constellation, called ‘Flock’, consists of multiple launches of groups of individual Dove satellites into a 400 km orbit. Some of them were launched from the ISS. Therefore, on-orbit capacity is constantly improving in capability or quantity. Each Dove satellite is a CubeSat with a size of 10 x 10 x 34 cm. The complete PlanetScope constellation of approximately 130 satellites is able to image the entire land surface of the Earth every day, equating to a daily collection capacity of 200 million km². In 2014 the first Dove satellites started operationally acquiring images from the earth’s surface. The optical sensors mounted on the individual Dove satellites operate in the visual and near-infrared parts of the electromagnetic spectrum with a spatial resolution between 3 and 5 meters. A third generation of PlanetScope sensors (known as SuperDove or PSB.SD) is currently in orbit and is producing limited quantities of imagery with 5 spectral bands (BGRNIR + Red Edge). These satellites have the potential to produce imagery with 8 separate spectral bands. The PlanetScope data of this collection has been purchased by the German Space Agency with funds from the Ministry of Economy and is available for Germany-based researchers for scientific use. The data collection is maintained by the German Satellite Data Archive (D-SDA) of DLR’s Earth Observation Center and can be accessed via the EOWEB Geoportal. This collection comprises the PlanetScope L1B Basic Scene 4-band multispectral image products with three visual RGB and one near-infrared band. The Basic Scene product is a scaled Top of Atmosphere Radiance (at sensor) and sensor corrected product, providing imagery as seen from the spacecraft without correction for any geometric distortions. It has a scene-based framing, and is not mapped to a cartographic projection. If available, the Surface Reflectance layer which corrects for the effects of the Earth's atmosphere is added to the product.
-
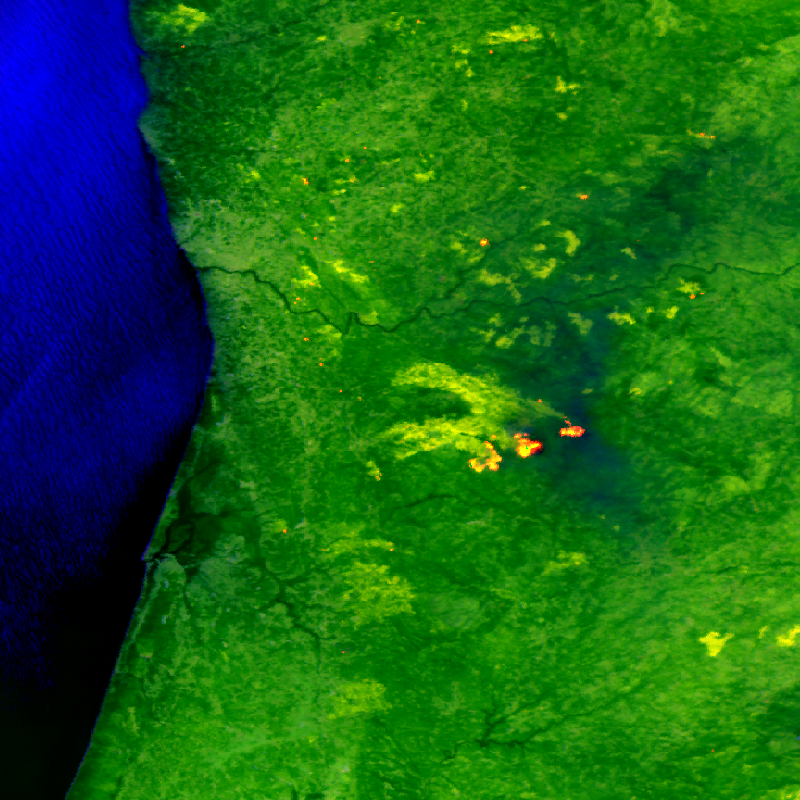
The FireBIRD mission consists of two small satellites, TET-1 and BIROS. Together, the two satellites are on an Earth observation mission that aims to detect forest fires, or high-temperature events, from space. The new infrared system provides high-quality data that is capable of measuring the spread of the fire and the amount of heat generated with great accuracy very early on - almost in real time - meaning that FireBIRD can serve as an early warning system. The data acquired from this Earth observation mission can also be used as a basis for scientific climate research. In addition to the main payload of the cameras, further experiments have been planned for developing the technology on board the small satellites. Further information can be found on the following website: http://www.dlr.de/firebird/en/ and in the FireBIRD brochure available at: http://www.dlr.de/firebird/en/Portaldata/79/Resources/dokumente/FireBIRD_Broschuere_HighRes_v3_english.pdf
-

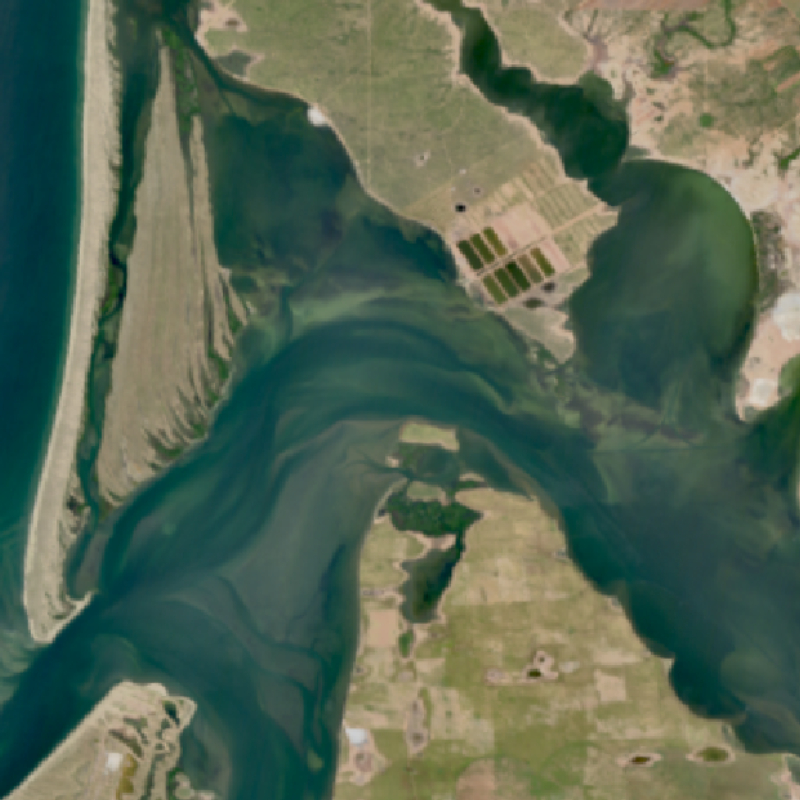
In July 2022 we mapped the tidal area of the Elbe near Cuxhaven and Brunsbüttel. The data was gathered by UAV (Unmanned Aerial Vehicle) with a RBG camera and a PDGNSS-Rover (Precice Differential Global Navigation Satellite System) in three areas: 1) Otterndorf at low tidal level (beach area), 2) Neufelderkoog at low tidal level (wadden area), 3) Neufeld at high tidal level (flooded reed area). For each area we provide a digital orthophoto and the correlation of the measurement timing to the local sea level. The measurements were obtained at the same time as the radar satellite Sentinel 1 crossed the area. The data is structured in three zip-archives corresponding to the study areas: 1) 20220712_Tnw_Otterndorf.zip: provides the time series data as comma-separated text files (CSV) provides (a) a digital orthophoto at 1,5 cm resolution, (b) an overview jpg showing of the measurement times and the local sea level, (c) timing of the UAV-flightlines and (d) two PDGNSS measurement series collected simultaneously as csv. (downloadable as 10.4 GB zip archive), 2) 20220712_Tnw_NeufelderkoogPriel.zip: provides (a) a digital orthophoto at 2 cm resolution and (b) an overview jpg showing of the measurement times and the local sea level (downloadable as 6,3 GB zip archive), 3) 20220720_Thw_Neufeld.zip: provides (a) a digital orthophoto at 2 cm resolution and (b) an overview jpg showing of the measurement times and the local sea level (downloadable as 8,4 GB zip archive). The data is used in the frame of the project "satellite based water-land-boundary detection" (Sat-Land-Fluss), as validation for Sentinel-1 derived water-land determinations. Sat-Land-Fluss was a R&D project lasting from 2020-2024, funded by the German Federal Ministry for Digital and Transport in the 4th project call "National Copernicus Application" (50EW2015).
-
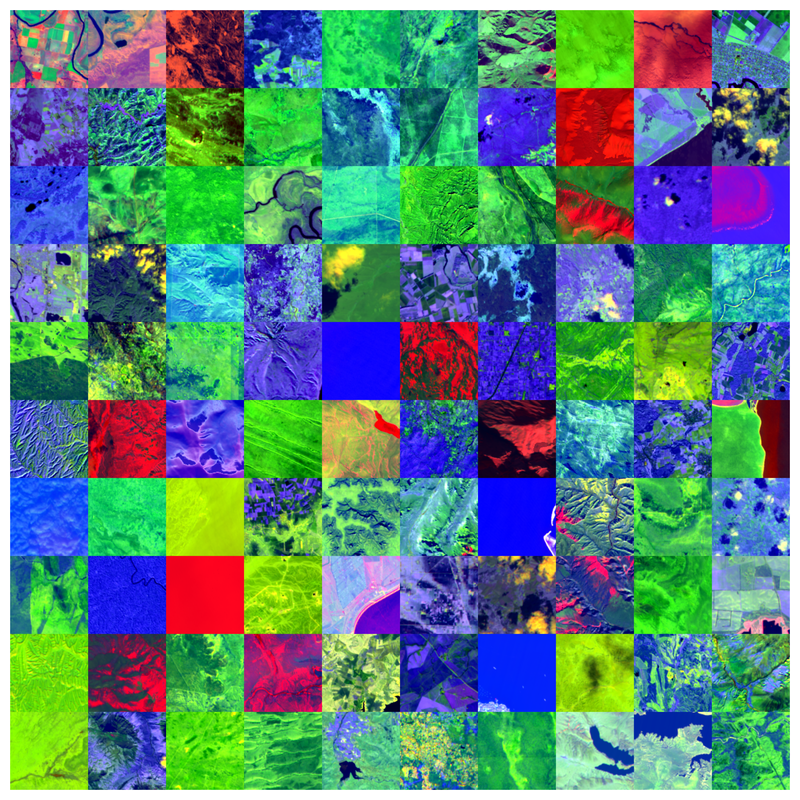
The Environmental Mapping and Analysis Program (EnMAP) is a German hyperspectral satellite mission to monitoring and characterise Earth’s environment on a global scale. EnMAP measures and models key dynamic processes of Earth’s ecosystems by extracting geochemical, biochemical and biophysical parameters that provide information on the status and evolution of various terrestrial and aquatic ecosystems. The mission’s main objective is to study and decipher coupled environmental processes and to assist and promote the sustainable management of Earth’s resources. This collection includes Level 0 quicklook images of the mission. For more information, please see the mission website: https://www.enmap.org/mission/