 www.geodatenkatalog.de (S2L)
Keyword
Remote Sensing
20 record(s)
Provided by
Type of resources
Update frequencies
Service types
-

The diverse geology of Germany and the resulting use are the causes of a wide variety of ground motions, such as soil compaction, landslides, groundwater extraction, natural gas extraction, (abandoned) mining and cavern storage operations. The products of the Ground Motion Service Germany (BBD) are based on SAR data from the Copernicus Sentinel-1 mission and Persistent Scatterer Interferometry (PSI) processing. The BBD portal contains PSI data from the entire Federal Republic of Germany (approx. 360,000 km²). PSI technology enables precise measurements of ground motions in the mm range. The decomposed virtual PS are visualized according to the mean velocity along vertical direction according to the following convention in the BBD portal: - the green color corresponds to the virtual PS, whose average speed is very low, between -2.0 and +2.0 mm/year, i.e. in the sensitivity range of the PSI technology; - those virtual PS with a negative movement rate are visualized in the colors from yellow to red, i.e. downward movement; - the colors from turquoise to blue visualize those virtual PS with a positive movement rate, i.e. upward movement. The precision of the PSI data presented is on the order of typically +- 2 mm/year for the average velocity.
-
The diverse geology of Germany and the resulting use are the causes of a wide variety of ground motions, such as soil compaction, landslides, groundwater extraction, natural gas extraction, (abandoned) mining and cavern storage operations. The products of the Ground Motion Service Germany (BBD) are based on SAR data from the Copernicus Sentinel-1 mission and Persistent Scatterer Interferometry (PSI) processing. The BBD portal contains PSI data from the entire Federal Republic of Germany (approx. 360,000 km²). PSI technology enables precise measurements of ground motions in the mm range. The measuring points (Persistent Scatterer, PS) correspond to objects already present on the ground, such as buildings, infrastructure or natural objects such as rocks. Each PS is characterized by a velocity value averaged over several years (expressed in mm/year) and a time series of displacements. For each PS, the time series of displacements from the first Sentinel-1 acquisition to the last evaluated Sentinel-1 acquisition can be viewed. The PS are visualized according to the mean velocity along the line of sight (LOS) of the Sentinel-1 satellites according to the following convention in the BBD portal: - the green color corresponds to the PS, whose average speed is very low, between -2.0 and +2.0 mm/year, i.e. in the sensitivity range of the PSI technology; - those PS with a negative movement rate are visualized in the colors from yellow to red, i.e. movements away from the satellite; - the colors from turquoise to blue visualize those PS with a positive movement rate, i.e. PS that are approaching the satellite. The precision of the PSI data presented is on the order of typically +- 2 mm/year for the average velocity in LOS.
-
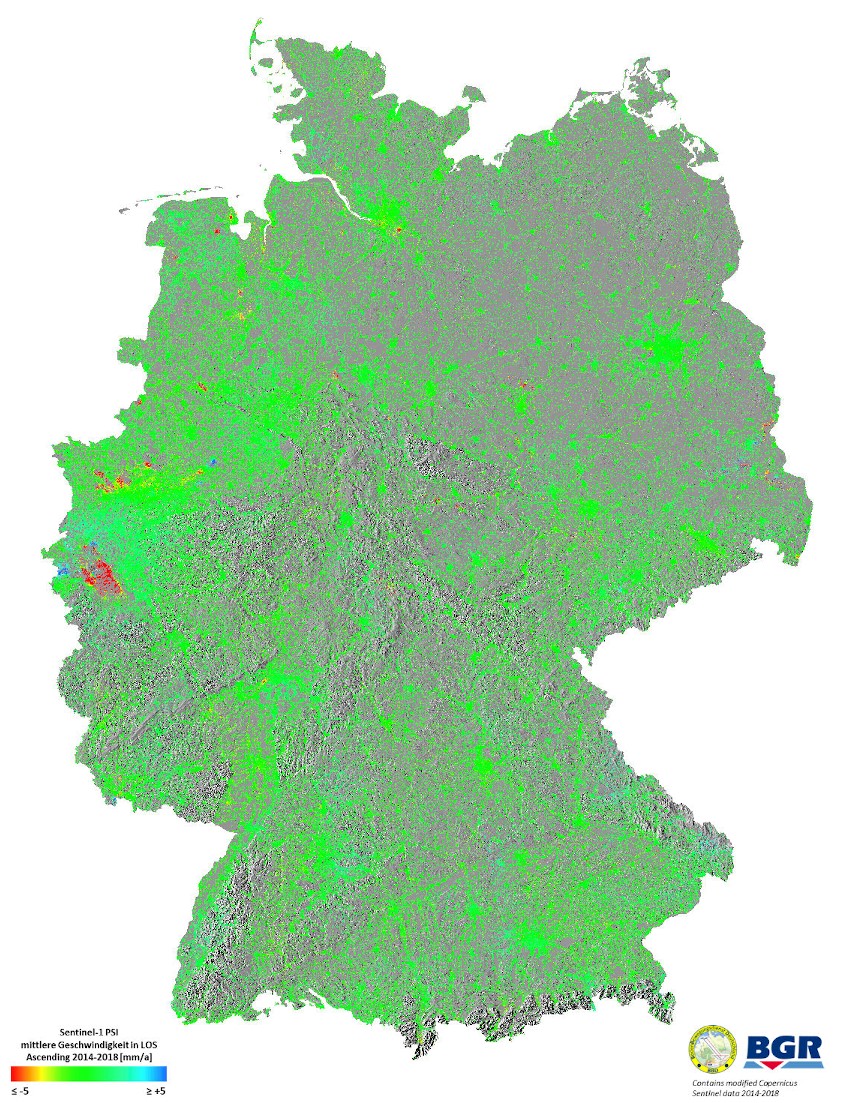
The data set provides information on the surface deformation of Germany. The surface deformation is color coded as the mean velocity over the time span indicated in the title. The data set was generated using a Persistent Scatterer Interferometry analysis based on Copernicus Sentinel-1 SAR data. The data set contains modified Copernicus Sentinel-1 data 2014-2019
-
The diverse geology of Germany and the resulting use are the causes of a wide variety of ground motions, such as soil compaction, landslides, groundwater extraction, natural gas extraction, (abandoned) mining and cavern storage operations. The products of the Ground Motion Service Germany (BBD) are based on SAR data from the Copernicus Sentinel-1 mission and Persistent Scatterer Interferometry (PSI) processing. The BBD portal contains PSI data from the entire Federal Republic of Germany (approx. 360,000 km²). PSI technology enables precise measurements of ground motions in the mm range. The decomposed virtual PS are visualized according to the mean velocity along East-West direction according to the following convention in the BBD portal: - the green color corresponds to the virtual PS, whose average speed is very low, between -2.0 and +2.0 mm/year, i.e. in the sensitivity range of the PSI technology; - those virtual PS with a negative movement rate are visualized in the colors from yellow to red, i.e. movements to the West; - the colors from turquoise to blue visualize those virtual PS with a positive movement rate, i.e. movements to the East. The precision of the PSI data presented is on the order of typically +- 2 mm/year for the average velocity.
-
The diverse geology of Germany and the resulting use are the causes of a wide variety of ground motions, such as soil compaction, landslides, groundwater extraction, natural gas extraction, (abandoned) mining and cavern storage operations. The products of the Ground Motion Service Germany (BBD) are based on SAR data from the Copernicus Sentinel-1 mission and Persistent Scatterer Interferometry (PSI) processing. The BBD portal contains PSI data from the entire Federal Republic of Germany (approx. 360,000 km²). PSI technology enables precise measurements of ground motions in the mm range. The measuring points (Persistent Scatterer, PS) correspond to objects already present on the ground, such as buildings, infrastructure or natural objects such as rocks. Each PS is characterized by a velocity value averaged over several years (expressed in mm/year) and a time series of displacements. For each PS, the time series of displacements from the first Sentinel-1 acquisition to the last evaluated Sentinel-1 acquisition can be viewed. The PS are visualized according to the mean velocity along the line of sight (LOS) of the Sentinel-1 satellites according to the following convention in the BBD portal: - the green color corresponds to the PS, whose average speed is very low, between -2.0 and +2.0 mm/year, i.e. in the sensitivity range of the PSI technology; - those PS with a negative movement rate are visualized in the colors from yellow to red, i.e. movements away from the satellite; - the colors from turquoise to blue visualize those PS with a positive movement rate, i.e. PS that are approaching the satellite. The precision of the PSI data presented is on the order of typically +- 2 mm/year for the average velocity in LOS.
-
Spatially and temporally high-resolution data was acquired with the aid of multispectral sensors mounted on UAV and a gyrocopter platform for the purpose of classification. The work was part of the research and development project „Modern sensors and airborne remote sensing for the mapping of vegetation and hydromorphology along Federal waterways in Germany“ (mDRONES4rivers) in cooperation of the German Federal Institute of Hydrology (BfG), Geocoptix GmbH, Hochschule Koblenz und JB Hyperspectral Devices. Within the project period (2019-2022) an object oriented image classification was conducted based on UAV and gyrocopter data for different sites situated in Germany along the Rivers Rhine and Oder. All published data produced within the project can be found by searching for the keyword ‘mDRONES4rivers‘. In this dataset, the following classification results and metadata of the project sites situated in riparian zones along federal waterways in Germany with focus on the Rhine River, Germany is available for download: • Basic & Vegetation Classification (ESRI Shapefile; abbreviation: lvl2_vegetation_units) • Classification of dominant stands (ESRI Shapefile; abbreviation: lvl4_dominant_stands ) • Classification of substrat types (ESRI Shapefile; abbreviation: lvl4_substrate_types) • associated reports (PDF; statistical and additional information on the classifiaction results and workflow) The above-mentioned files are provided for download as dataset stored in one directory per projekt site and season (e.g. mDRONES4rivers_Niederwerth_2019_03_Summer_Classification.zip = projectname_projectsite_year_no.season_name.season_product). To provide an overview of all files and general background information plus data preview the following files are additionally provided: • Portfolios (PDF, Detailed description of classification products and classification workflow, 1x for basic surface types, 1x for classification of vegetation units, 1x for classification of dominant stands, 1x for classification of substrate types) • Color Coding table for the visualization of the classifiaction units (.xlsx)