 My GeoNetwork catalogue
irregular
Provided by
Type of resources
Available actions
Topics
Keywords
Contact for the resource
Update frequencies
Service types
-
-
-
-
-
-

The hyperspectral instrument DESIS (DLR Earth Sensing Imaging Spectrometer) is one of four possible payloads of MUSES (Multi-User System for Earth Sensing), which is mounted on the International Space Station (ISS). DLR developed and delivered a Visual/Near-Infrared Imaging Spectrometer to Teledyne Brown Engineering, which was responsible for integrating the instrument. Teledyne Brown designed and constructed, integrated and tested the platform before delivered to NASA. Teledyne Brown collaborates with DLR in several areas, including basic and applied research for use of data. DESIS is operated in the wavelength range from visible through the near infrared and enables precise data acquisition from Earth's surface for applications including fire-detection, change detection, maritime domain awareness, and atmospheric research. Three product types can be ordered, which are Level 1B (systematic and radiometric corrected), Level 1C (geometrically corrected) and Level 2A (atmospherically corrected). The spatial resolution is about 30m on ground. DESIS is sensitive between 400nm and 1000nm with a spectral resolution of about 3.3nm. DESIS data are delivered in tiles of about 30x30km. For more information concerning DESIS the reader is referred to https://www.dlr.de/de/eoc/forschung-transfer/projekte-und-missionen/desis
-
-
-
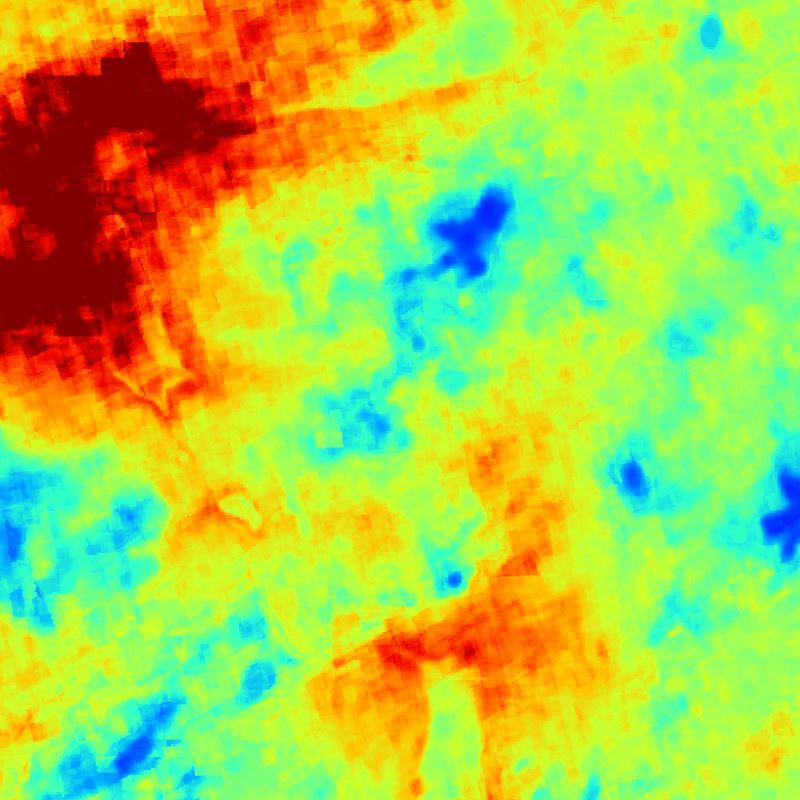
This collection contains monthly mean surface NO2 concentrations for Germany derived from Sentinel-5P/TROPOMI data. The Sentinel-5P NO2 data is generated by DLR and provided in the framework of the mFUND-Project "S-VELD". The surface NO2 data are concentrations with the unit "μg/m3". Sentinel-5P observes Germany once per day at ~12:00 UTC and only cloud-free measurements (cloud fraction less than ~0.2) are used. The Sentinel-5P surface NO2 data within each month are averaged and gridded onto a regular UTM grid. The number of measurements used in the calculation of the averaged value are included in this collection as well.
-

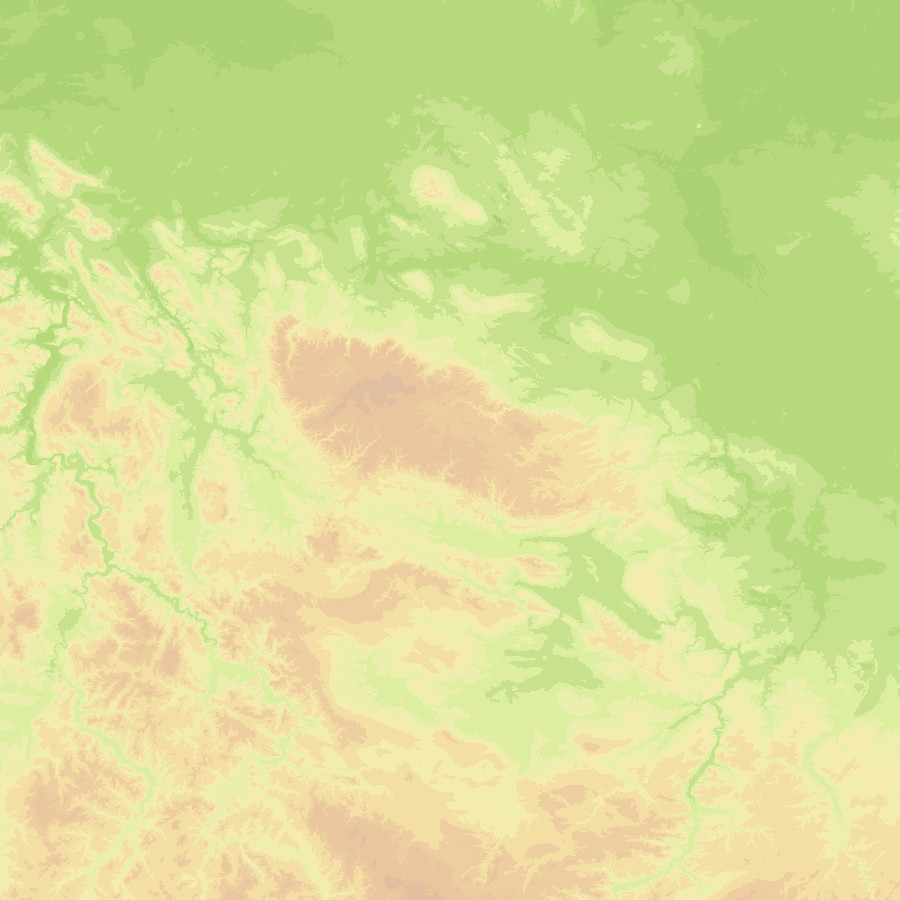
The digital terrain model of waterways for the estuary of river Elbe (DGM-W 2016) in high resolution based on airborne laser scanning and echo sounder data is produced and published by the German Federal Waterways and Shipping Administration (Wasserstraßen- und Schifffahrtsverwaltung des Bundes, WSV). The data includes the Outer Elbe and the tidally influenced side branches of the Elbe estuary upstream to the town Geesthacht. The data is available in a raster resolution of 1 meter. Coordinate reference system: EPSG 25852, ETRS89 / UTM Zone 32N Elevation reference system: DHHN92, NHN Survey methods: Airborne laser scanning (ALS) 02. - 04.2016 Multibeam echo sounder, single beam echo sounder 2015-2017 It is strongly recommended to use the data source map for quality assessment.