 www.geodatenkatalog.de (S3F)
Catalog

248 record(s)
Provided by
Type of resources
Available actions
Topics
Keywords
Contact for the resource
Update frequencies
Service types
-
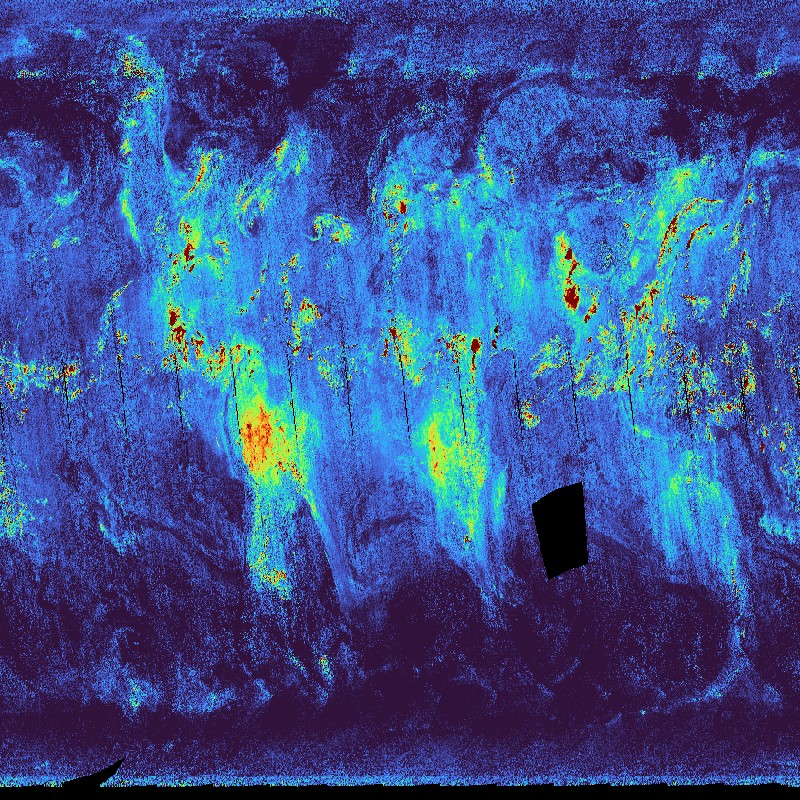
The TROPOMI instrument onboard the Copernicus SENTINEL-5 Precursor satellite is a nadir-viewing, imaging spectrometer that provides global measurements of atmospheric properties and constituents on a daily basis. It is contributing to monitoring air quality and climate, providing critical information to services and decision makers. The instrument uses passive remote sensing techniques by measuring the top of atmosphere solar radiation reflected by and radiated from the earth and its atmosphere. The four spectrometers of TROPOMI cover the ultraviolet (UV), visible (VIS), Near Infra-Red (NIR) and Short Wavelength Infra-Red (SWIR) domains of the electromagnetic spectrum. The operational trace gas products generated at DLR on behave ESA are: Ozone (O3), Nitrogen Dioxide (NO2), Sulfur Dioxide (SO2), Formaldehyde (HCHO), Carbon Monoxide (CO) and Methane (CH4), together with clouds and aerosol properties. This product displays the Formaldehyde (HCHO) concentration around the globe. The major HCHO sources are vegetation, fires, traffic and industrial sources. Daily observations are binned onto a regular latitude-longitude grid. This product is created in the scope of the project INPULS. It develops (a) innovative retrieval algorithms and processors for the generation of value-added products from the atmospheric Copernicus missions Sentinel-5 Precursor, Sentinel-4, and Sentinel-5, (b) cloud-based (re)processing systems, (c) improved data discovery and access technologies as well as server-side analytics for the users, and (d) data visualization services.
-

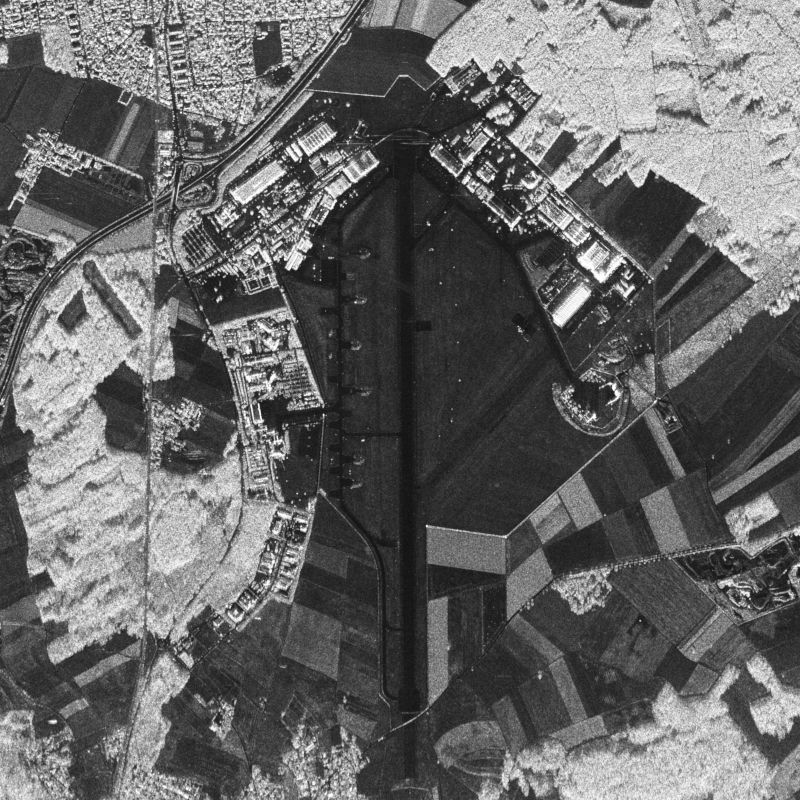
This collection contains radar image products of the German national TerraSAR-X mission acquired in ScanSAR mode. ScanSAR imaging allows for a spatial resolution of up to 18.5 m at a scene size of 100 km (across swath) x 150-1650 km (in orbit direction) in regular ScanSAR mode (4 beams) and up to 270 km (across swath) x 200-1500 km (in orbit direction) in Wide ScanSAR mode (6 beams). TerraSAR-X is a sun-synchronous polar-orbiting, all-weather, day-and-night X-band radar earth observation mission realized in the frame of a public-private partnership between the German Aerospace Center (DLR) and Airbus Defence and Space. For more information concerning the TerraSAR-X mission, the reader is referred to: https://www.dlr.de/content/de/missionen/terrasar-x.html
-

The TROPOMI instrument onboard the Copernicus SENTINEL-5 Precursor satellite is a nadir-viewing, imaging spectrometer that provides global measurements of atmospheric properties and constituents on a daily basis. It is contributing to monitoring air quality and climate, providing critical information to services and decision makers. The instrument uses passive remote sensing techniques by measuring the top of atmosphere solar radiation reflected by and radiated from the earth and its atmosphere. The four spectrometers of TROPOMI cover the ultraviolet (UV), visible (VIS), Near Infra-Red (NIR) and Short Wavelength Infra-Red (SWIR) domains of the electromagnetic spectrum. The operational trace gas products generated at DLR on behave ESA are: Ozone (O3), Nitrogen Dioxide (NO2), Sulfur Dioxide (SO2), Formaldehyde (HCHO), Carbon Monoxide (CO) and Methane (CH4), together with clouds and aerosol properties. This product displays the Cloud Optical Thickness (COT) around the globe. Clouds play a crucial role in the Earth's climate system and have significant effects on trace gas retrievals. The cloud optical thickness is retrieved from the O2-A band using the ROCINN algorithm. Daily observations are binned onto a regular latitude-longitude grid. This product is created in the scope of the project INPULS. It develops (a) innovative retrieval algorithms and processors for the generation of value-added products from the atmospheric Copernicus missions Sentinel-5 Precursor, Sentinel-4, and Sentinel-5, (b) cloud-based (re)processing systems, (c) improved data discovery and access technologies as well as server-side analytics for the users, and (d) data visualization services.
-
E-SAR, “Experimental-SAR”, is an airborne imaging radar (Synthetic Aperture Radar) sensor operated by the German Aerospace Center (DLR), Microwaves and Radar Institute (HR) from 1988 until November 2009. It was operated on a Dornier Do-228 aircraft from altitudes of 2000 to 6000 m above ground in four different center frequency bands (X,C,L,P). Different center frequencies were operated sequentially in different overflights. Data were acquired either in one-channel, two-channel or four-channel mode in HH, HV, VV and/or VH polarization. Fully polarimetric data are available in L- and P-band only. Repeat-pass interferometry is available in L- and P-band. Single-pass interferometry is available in X-band only, in along- and across-track antenna configuration. Data are processed up to two different levels: RGI (Radar Geometry Image product) and GTC (Geocoded and Terrain-Corrected product). Resolutions range from 25 cm (X-band) to 1.5 m (P-band) in azimuth direction and from 1.8 m (X-band) to 3 m (P-band) in range direction. Data acquisition modes are “stripmap”, “repeat-pass” (two parallel tracks) or “tomography” (several parallel tracks). For more information concerning E-SAR data, the reader is referred to: www.dlr.de/hr/e-sar
-

The TROPOMI instrument onboard the Copernicus SENTINEL-5 Precursor satellite is a nadir-viewing, imaging spectrometer that provides global measurements of atmospheric properties and constituents on a daily basis. It is contributing to monitoring air quality and climate, providing critical information to services and decision makers. The instrument uses passive remote sensing techniques by measuring the top of atmosphere solar radiation reflected by and radiated from the earth and its atmosphere. The four spectrometers of TROPOMI cover the ultraviolet (UV), visible (VIS), Near Infra-Red (NIR) and Short Wavelength Infra-Red (SWIR) domains of the electromagnetic spectrum. The operational trace gas products generated at DLR on behave ESA are: Ozone (O3), Nitrogen Dioxide (NO2), Sulfur Dioxide (SO2), Formaldehyde (HCHO), Carbon Monoxide (CO) and Methane (CH4), together with clouds and aerosol properties. This product displays the Cloud Fraction (CF) around the globe. Clouds play a crucial role in the Earth's climate system and have significant effects on trace gas retrievals. The radiometric cloud fraction is retrieved from the UV using the OCRA algorithm. Daily observations are binned onto a regular latitude-longitude grid. This product is created in the scope of the project INPULS. It develops (a) innovative retrieval algorithms and processors for the generation of value-added products from the atmospheric Copernicus missions Sentinel-5 Precursor, Sentinel-4, and Sentinel-5, (b) cloud-based (re)processing systems, (c) improved data discovery and access technologies as well as server-side analytics for the users, and (d) data visualization services.
-
Indian Remote Sensing satellites (IRS) are a series of Earth Observation satellites, built, launched and maintained by Indian Space Research Organisation. The IRS series provides many remote sensing services to India and international ground stations.
-
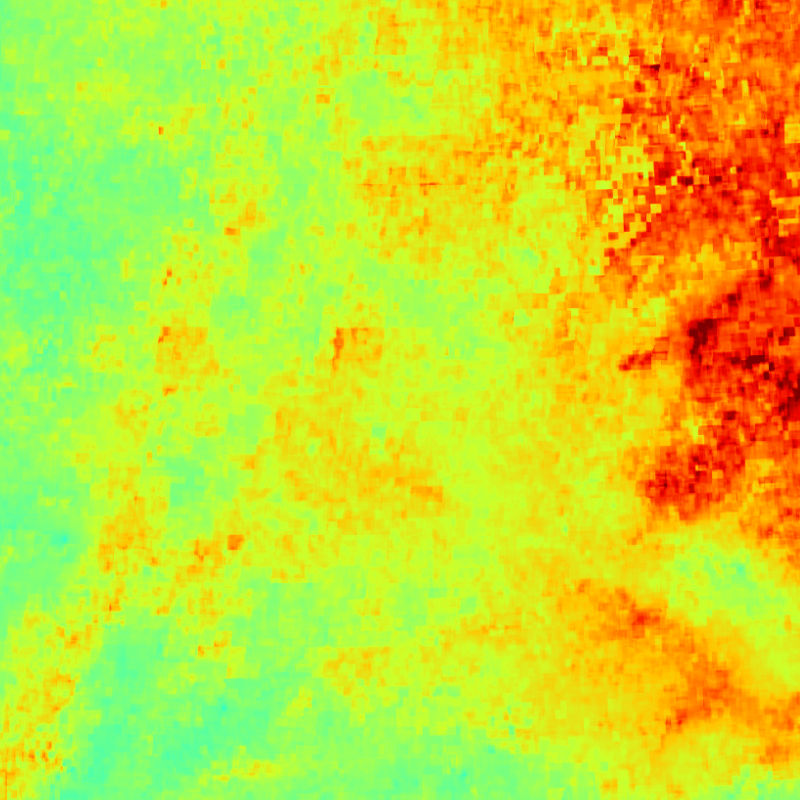
This collection contains monthly mean surface PM2.5 concentrations for Germany and parts of the surrounding countries. PM2.5 surface concentrations are derived from Aqua/MODIS and Sentinel-3A/SLSTR AOD data and provided as merged MODIS/SLSTR product. The data is generated by DLR and provided in the framework of the mFUND-Project "S-VELD". The surface PM2.5 data are concentrations with the unit "µg/m3". The satellites Aqua (NASA) and Sentinel-3 (Copernicus) observe Germany on a daily basis. PM2.5 concentrations were derived on a daily basis from the two AOD products separately and combined to a merged MODIS/SLSR surface PM2.5 product. The data within each month are averaged and gridded onto a regular UTM grid. As AOD measurements are strongly depending on cloud conditions, the spatial coverage can be limited, especially in the winter months.
-
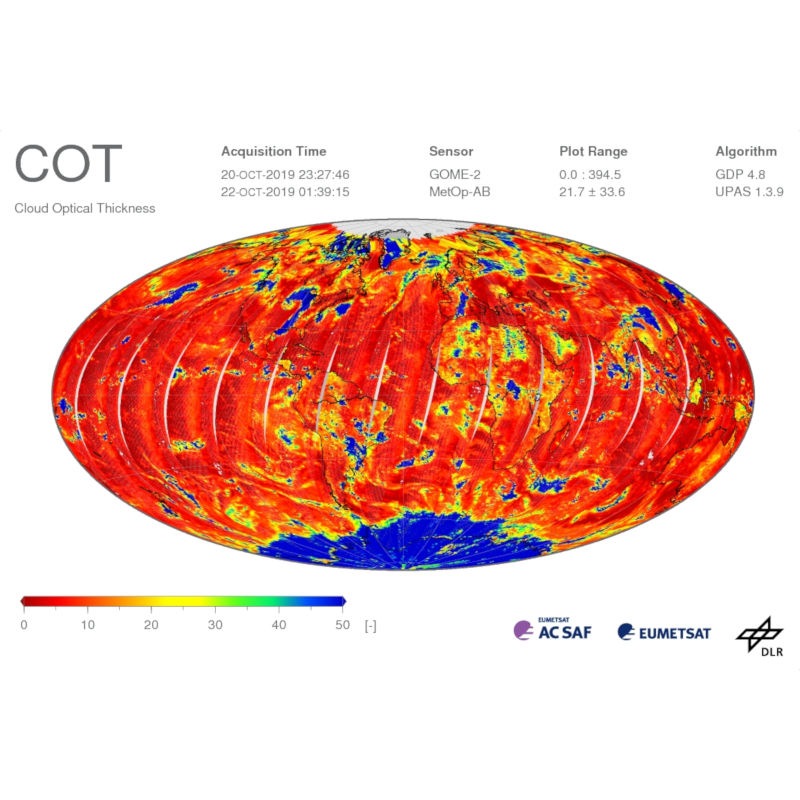
The Global Ozone Monitoring Experiment-2 (GOME-2) instrument continues the long-term monitoring of atmospheric trace gas constituents started with GOME / ERS-2 and SCIAMACHY / Envisat. Currently, there are three GOME-2 instruments operating on board EUMETSAT's Meteorological Operational satellites MetOp-A, -B and -C, launched in October 2006, September 2012, and November 2018, respectively. GOME-2 can measure a range of atmospheric trace constituents, with the emphasis on global ozone distributions. Furthermore, cloud properties and intensities of ultraviolet radiation are retrieved. These data are crucial for monitoring the atmospheric composition and the detection of pollutants. DLR generates operational GOME-2 / MetOp level 2 products in the framework of EUMETSAT's Satellite Application Facility on Atmospheric Chemistry Monitoring (AC-SAF). GOME-2 near-real-time products are available already two hours after sensing. OCRA (Optical Cloud Recognition Algorithm) and ROCINN (Retrieval of Cloud Information using Neural Networks) are used for retrieving the following geophysical cloud properties from GOME and GOME-2 data: cloud fraction (cloud cover), cloud-top pressure (cloud-top height), and cloud optical thickness (cloud-top albedo). OCRA is an optical sensor cloud detection algorithm that uses the PMD devices on GOME / GOME-2 to deliver cloud fractions for GOME / GOME-2 scenes. ROCINN takes the OCRA cloud fraction as input and uses a neural network training scheme to invert GOME / GOME-2 reflectivities in and around the O2-A band. VLIDORT [Spurr (2006)] templates of reflectances based on full polarization scattering of light are used to train the neural network. ROCINN retrieves cloud-top pressure and cloud-top albedo. The cloud optical thickness is computed using libRadtran [Mayer and Kylling (2005)] radiative transfer simulations taking as input the cloud-top albedo retrieved with ROCINN. For more details please refer to relevant peer-review papers listed on the GOME and GOME-2 documentation pages: https://atmos.eoc.dlr.de/app/docs/
-
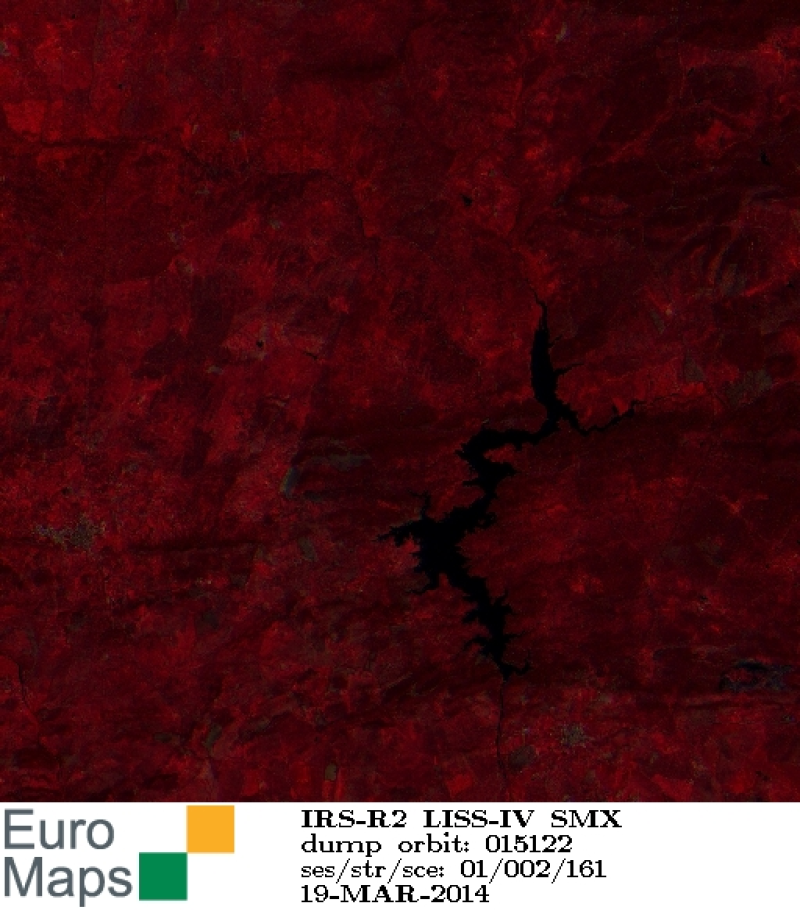
Indian Remote Sensing satellites (IRS) are a series of Earth Observation satellites, built, launched and maintained by Indian Space Research Organisation. The IRS series provides many remote sensing services to India and international ground stations. With 5 m resolution and products covering areas up to 23.5 km x 23.5 km IRS LISS-IV multispectral data provide a cost effective solution for mapping tasks up to 1:25'000 scale.
-
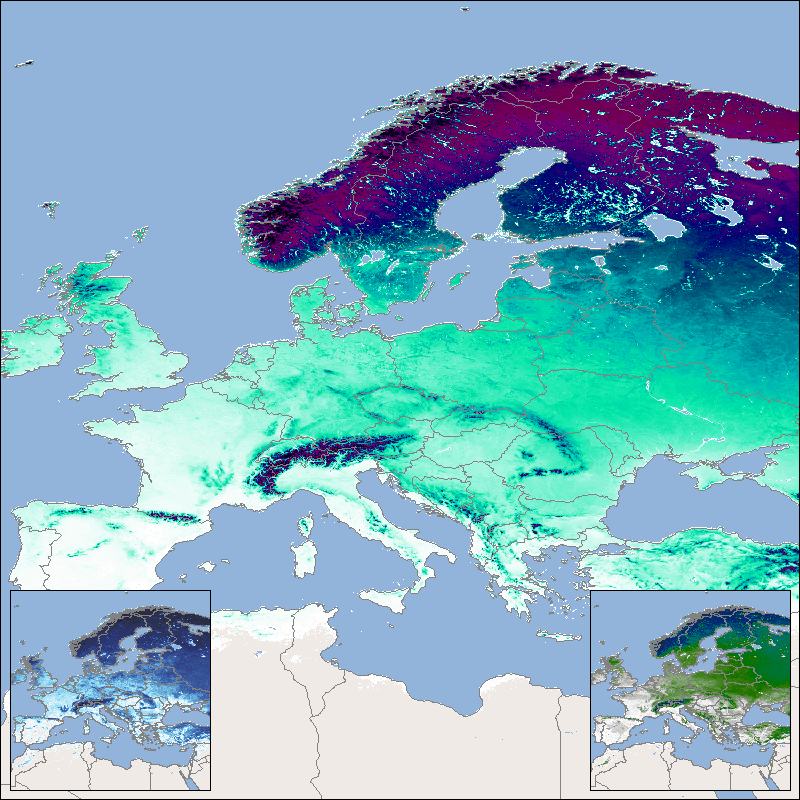
This product shows the snow cover duration for a hydrological year. Its beginning differs from the calendar year, since some of the precipitation that falls in late autumn and winter falls as snow and only drains away when the snow melts in the following spring or summer. The meteorological seasons are used for subdivision and the hydrological year begins in autumn and ends in summer. The snow cover duration is made available for three time periods: the snow cover duration for the entire hydrological year (SCD), the early snow cover duration (SCDE), which extends from autumn to midwinter (), and the late snow cover duration (SCDL), which in turn extends over the period from mid-winter to the end of summer. For the northern hemisphere SCD lasts from September 1st to August 31st, for the southern hemisphere it lasts from March 1st to February 28th/29th. The SCDE lasts from September 1st to January 14th in the northern hemisphere and from March 1st to July 14th in the southern hemisphere. The SCDL lasts from January 15th to August 31st in the northern hemisphere and from July 15th to February 28th/29th in the southern hemisphere. The “Global SnowPack” is derived from daily, operational MODIS snow cover product for each day since February 2000. Data gaps due to polar night and cloud cover are filled in several processing steps, which provides a unique global data set characterized by its high accuracy, spatial resolution of 500 meters and continuous future expansion. It consists of the two main elements daily snow cover extent (SCE) and seasonal snow cover duration (SCD; full and for early and late season). Both parameters have been designated by the WMO as essential climate variables, the accurate determination of which is important in order to be able to record the effects of climate change. Changes in the largest part of the cryosphere in terms of area have drastic effects on people and the environment. For more information please also refer to: Dietz, A.J., Kuenzer, C., Conrad, C., 2013. Snow-cover variability in central Asia between 2000 and 2011 derived from improved MODIS daily snow-cover products. International Journal of Remote Sensing 34, 3879–3902. https://doi.org/10.1080/01431161.2013.767480 Dietz, A.J., Kuenzer, C., Dech, S., 2015. Global SnowPack: a new set of snow cover parameters for studying status and dynamics of the planetary snow cover extent. Remote Sensing Letters 6, 844–853. https://doi.org/10.1080/2150704X.2015.1084551 Dietz, A.J., Wohner, C., Kuenzer, C., 2012. European Snow Cover Characteristics between 2000 and 2011 Derived from Improved MODIS Daily Snow Cover Products. Remote Sensing 4. https://doi.org/10.3390/rs4082432 Dietz, J.A., Conrad, C., Kuenzer, C., Gesell, G., Dech, S., 2014. Identifying Changing Snow Cover Characteristics in Central Asia between 1986 and 2014 from Remote Sensing Data. Remote Sensing 6. https://doi.org/10.3390/rs61212752 Rößler, S., Witt, M.S., Ikonen, J., Brown, I.A., Dietz, A.J., 2021. Remote Sensing of Snow Cover Variability and Its Influence on the Runoff of Sápmi’s Rivers. Geosciences 11, 130. https://doi.org/10.3390/geosciences11030130