 My GeoNetwork catalogue
DLR
Provided by
Type of resources
Available actions
Topics
Keywords
Contact for the resource
Update frequencies
Service types
-
The EnMAP HSI L2A dataset collection comprises a standardized, consistent, systematically processed, and cloud-native level-2A dataset series for the entire mission. It is especially useful for big data or time series analyses. The dataset is processed with the atmospheric correction over land processor and is provided in cloud-optimized GeoTIFF format for direct access and download. The metadata follows the CEOS Analysis Ready Data (CEOS-ARD) framework. The database is constantly updated with newly acquired data. The Environmental Mapping and Analysis Program (EnMAP) is a German hyperspectral satellite mission that monitors and characterizes Earth’s environment on a global scale. EnMAP delivers accurate data that provides information on the status and evolution of terrestrial and aquatic ecosystems, supporting environmental monitoring, management, and decision-making. For more information, please see the mission website: https://www.enmap.org/mission/
-

The map shows the Al Zaatari refugee camp in Jordan. It is situated approx. 12 km from the Syrian border and in close proximity to the city of Al Mafraq (10 km). The camp was set up on July 28, 2012, to shelter refugees fleeing the conflict in Syria. The map shows general characteristics of the camp infrastructure, including camp extent, location of shelters, containers and facility buildings, road infrastructure and the runway area. For a more detailed view parts of the camp area are also shown in the zoom boxes. The vector data have been digitized on the basis of WorldView-2 satellite data (0.5 m spatial resolution) acquired on January 03, 2013. The results have not been validated in the field. WorldView-2 satellite data acquired on January 03, 2013, is used as backdrop. The products elaborated for this Rapid Mapping Activity are realised to the best of our ability, within a very short time frame, optimising the material available. All geographic information has limitations due to the scale, resolution, date and interpretation of the original source materials. No liability concerning the content or the use thereof is assumed by the producer. The ZKI crisis maps are constantly updated.
-
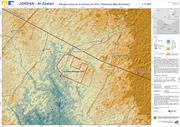
The map shows the elevation of the surroundings of the Al Zaatari refugee camp in Jordan. The elevation information is derived from ASTER GDEM 2 data (vertical accuracy +/- 6m). Furthermore basic reference information, digitized on the basis of WorldView-2 satellite data acquired on January 03, 2013, at 08:52:52 UTC and LANDSAT-7 data acquired on December 16, 2012 at 08:07:11 UTC, is depicted. Not all settlements are captured. The results have not been validated in the field. ASTER GDEM 2 data as well as a hillshade derived from this data is used as backdrop. Please note, that information on elevation derived from ASTER data does not apply for the refugee camp area. ASTER data was acquired before 2011 and the elevation might have changed due to construction works. The products elaborated for this Rapid Mapping Activity are realised to the best of our ability, within a very short time frame, optimising the material available. All geographic information has limitations due to the scale, resolution, date and interpretation of the original source materials. No liability concerning the content or the use thereof is assumed by the producer. The ZKI crisis maps are constantly updated. Please make sure to visit http://www.zki.dlr.de for the latest version of this product.
-
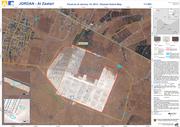
The Al Zaatari refugee camp in Jordan is situated approx. 12 km from the Syrian border and in close proximity to the city of Al Mafraq (10 km). Due to heavy rainfall in the region parts of the Zaatari camp are affected by flooding. The map shows the flood situation derived by semi-automatic image analysis of TerraSAR-X data acquired on January 10, 2013 at 03:38:49 UTC. Furthermore basic reference information, digitized on the basis of WorldView-2 satellite data acquired on January 03, 2013, at 08:52:52 UTC, is depicted. The contour lines were derived from ASTER GDEM 2 data (vertical accuracy +/- 6m). For a more detailed view on the flood situation, parts of the camp area are also shown in the zoom boxes. The results of the image interpretation and analysis have not been validated in the field. WorldView-2 satellite data acquired on January 03, 2013, is used as backdrop. Please note that flood waters in settlement areas might not be fully captured and the water extent might be underestimated due to sensor characteristics. Thus especially shallow water bodies might not be fully captured. The products elaborated for this Rapid Mapping Activity are realised to the best of our ability, within a very short time frame, optimising the material available. All geographic information has limitations due to the scale, resolution, date and interpretation of the original source materials. No liability concerning the content or the use thereof is assumed by the producer. The ZKI crisis maps are constantly updated. Please make sure to visit http://www.zki.dlr.de for the latest version of this product.
-
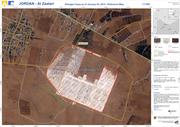
The map shows the Al Zaatari refugee camp in Jordan. It is situated approx. 12 km from the Syrian border and in close proximity to the city of Al Mafraq (10 km). The camp was set up on July 28, 2012 to shelter refugees fleeing the conflict in Syria. The vector data have been digitized on the basis of WorldView-2 satellite data (0.5m spatial resolution) acquired on January 03, 2013. The results have not been validated in the field. WorldView-2 satellite data acquired on January 03, 2013 is used as backdrop. The products elaborated for this Rapid Mapping Activity are realised to the best of our ability, within a very short time frame, optimising the material available. All geographic information has limitations due to the scale, resolution, date and interpretation of the original source materials. No liability concerning the content or the use thereof is assumed by the producer. The ZKI crisis maps are constantly updated. Please make sure to visit http://www.zki.dlr.de for the latest version of this product.
-
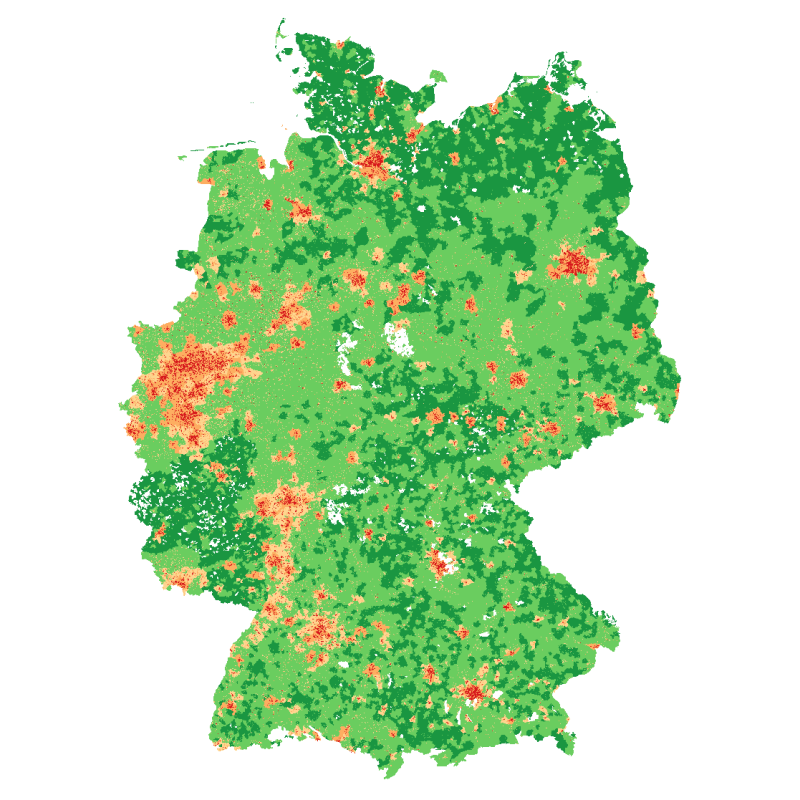
The degree of urbanization provides urbanization level information at 100x100 meter grids for Germany. It is based on population numbers, building density and the share of building types. It is provided as a continuous percentage value representing the probability of the degree of urbanization, as well as five discrete values representing classes of the degree of urbanization: definitely ‘urban’, probably ‘urban’, area of uncertainty, probably ‘rural’, definitely ‘rural’.
-

This vector dataset is based on a 10 m resolution raster dataset that shows forest canopy cover loss (FCCL) in Germany at a monthly resolution from September 2017 to September 2024. Results at pixel level were aggregated at municipality, district, and federal state level. For the results at administrative level we differentiate between deciduous and coniferous forests. We use the stocked area map 2018 (Langner et al. 2022, https://doi.org/10.3220/DATA20221205151218 ) as a reference forest mask. We differentiate between deciduous and coniferous forests by intersecting the stocked area map with a tree species map (Blickensdoerfer et al. 2024). Pixels of the classes birch, beech, oak, alder, deciduous trees with long lifespan and deciduous trees with short lifespan were classified as deciduous forest and pixels of the classes Douglas fir, spruce, pine, larch and fir as coniferous forest. The coverage of the two datasets is not identical, which is why a few areas of the forest reference map remained unclassified. These were filled with the dominant leaf type map of the Copernicus Land Monitoring Service (CLMS 2025). Therefore, the vector data at administrative level contains information about unclassified forest areas and the total forest area as the sum of deciduous, coniferous, and unclassified forests. The FCCL confidence at pixel level is lowest at the end of the time series because the number of repeated threshold exceedance is used as a criterion to record forest canopy cover losses. Therefore, we excluded July 2024 through September 2024 from the annual and overall statistics and summarized the respective FCCL as additional attribute. The dataset is a fully reprocessed continuation of the assessment in Thonfeld et al. (2022).
-
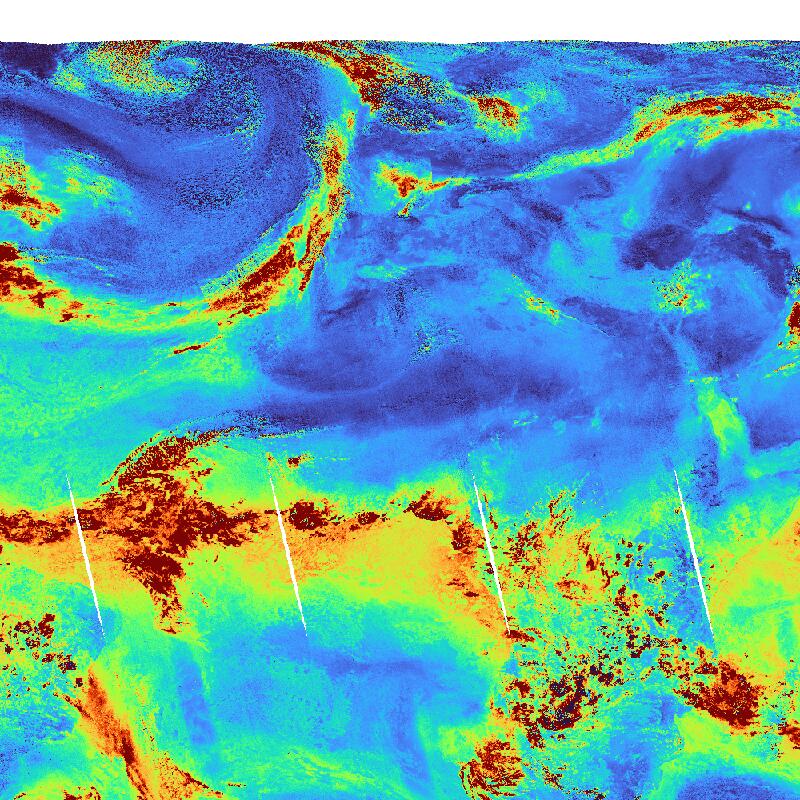
Water Vapour (H2O) concentration (globally) as derived from Sentinel-5P/TROPOMI observations. H2O is the most abundant greenhouse gas in the atmosphere. In addition it is one of the most powerful drivers for weather phenomena in the troposphere. Daily observations are binned onto a regular latitude-longitude grid. The TROPOMI instrument aboard the SENTINEL-5P space craft is a nadir-viewing, imaging spectrometer covering wavelength bands between the ultraviolet and the shortwave infra-red. TROPOMI's purpose is to measure atmospheric properties and constituents. It is contributing to monitoring air quality and providing critical information to services and decision makers. The instrument uses passive remote sensing techniques by measuring the Top Of Atmosphere (TOA) solar radiation reflected by and radiated from the earth and its atmosphere. The four spectrometers of TROPOMI cover the ultraviolet (UV), visible (VIS), Near Infra-Red (NIR) and Short Wavelength Infra-Red (SWIR) domains of the electromagnetic spectrum, allowing operational retrieval of the following trace gas constituents: Ozone (O3), Nitrogen Dioxide (NO2), Sulfur Dioxide (SO2), Water Vapour (H2O), Carbon Monoxide (CO) and Methane (CH4). Within the INPULS project, innovative algorithms and processors for the generation of Level 3 and Level 4 products, improved data discovery and access technologies as well as server-side analytics for the users are developed.
-
This WMS provides access to different elevation products provided by the Earth Observation Center (EOC) of the DLR.
-

UV Index (UVI) as derived from TROPOMI observations. The UVI describes the intensity of the solar ultraviolet radiation. Values around zero indicate low, values greater than 10 indicate very high UV exposure on the ground. The TROPOMI instrument onboard the Copernicus SENTINEL-5 Precursor satellite is a nadir-viewing, imaging spectrometer that provides global measurements of atmospheric properties and constituents on a daily basis. It is contributing to monitoring air quality and climate, providing critical information to services and decision makers. The instrument uses passive remote sensing techniques by measuring the top of atmosphere solar radiation reflected by and radiated from the earth and its atmosphere. The four spectrometers of TROPOMI cover the ultraviolet (UV), visible (VIS), Near Infra-Red (NIR) and Short Wavelength Infra-Red (SWIR) domains of the electromagnetic spectrum. The operational trace gas products generated at DLR on behave ESA are: Ozone (O3), Nitrogen Dioxide (NO2), Sulfur Dioxide (SO2), Formaldehyde (HCHO), Carbon Monoxide (CO) and Methane (CH4), together with clouds and aerosol properties. This product is created in the scope of the project INPULS. It develops (a) innovative retrieval algorithms and processors for the generation of value-added products from the atmospheric Copernicus missions Sentinel-5 Precursor, Sentinel-4, and Sentinel-5, (b) cloud-based (re)processing systems, (c) improved data discovery and access technologies as well as server-side analytics for the users, and (d) data visualization services.