 My GeoNetwork catalogue
service-view
Provided by
Type of resources
Available actions
Keywords
Contact for the resource
Update frequencies
Service types
-
This dataset contains sea-borders based on Maritime Boundaries Geodatabase from Flanders Marine Institute. It contains borderlines of the Exclusive Economic Zone (EEZ) and the 12 nautical mile limit (SMZ) of Germany and neighbouring countries of North Sea and Baltic Sea. This data is compiled and prepared for displaying background information for metadata of geological surveys, according to Geological Data Act (GeolDG).
-
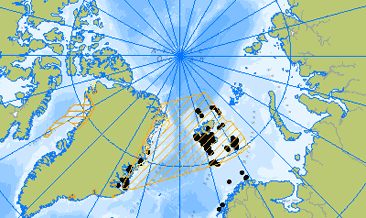
Four marine geophysical and marine geological expeditions were carried out within the PANORAMA project. 2013: Panorama1 with research vessel RV OGS Explora, northern Barents Sea and Eurasian Basin; 2015: Panorama2 with RV OGS Explora, northern Barents Sea, Olga Basin; 2017 SEGMENT with RV Maria S. Merian, northeastern continental margin Greenland; 2018 GREENMATE with RV Polarstern, northeastern and northern continental margin Greenland. Geophysical data include 2D reflection seismic data and refraction seismic data (with OBS and sonar buoy, respectively. In addition, hydroacoustic data were recorded with the onboard multibeam echosounders and sediment echosounders, respectively. Furthermore, gravimetric and magnetic data were recorded. Geological and geochemical data were acquired using gravity corer and multi-corer. In the framework of the project Greenmate (2018) specimens were collected from the shore of NE Greenland using helicopters. Results are available to date in the following publications: Berglar Kai, Franke Dieter, Lutz Rüdiger, Schreckenberger Bernd, Damm Volkmar; Initial Opening of the Eurasian Basin, Arctic Ocean; Frontiers in Earth Science; 2016; DOI=10.3389/feart.2016.00091 Rüdiger Lutz, Dieter Franke, Kai Berglar, Ingo Heyde, Bernd Schreckenberger, Peter Klitzke, Wolfram H. Geissler; Evidence for mantle exhumation since the early evolution of the slow-spreading Gakkel Ridge, Arctic Ocean; Journal of Geodynamics; 2018; https://doi.org/10.1016/j.jog.2018.01.014 Philipp Weniger, Martin Blumenberg, Kai Berglar, Axel Ehrhardt, Peter Klitzke, Martin Krüger, Rüdiger Lutz; Origin of near-surface hydrocarbon gases bound in northern Barents Sea sediments; Marine and Petroleum Geology; 2019 https://doi.org/10.1016/j.marpetgeo.2018.12.036 P. Klitzke, D. Franke, A. Ehrhardt, R. Lutz, L. Reinhardt, I. Heyde, J.I. Faleide; The paleozoic evolution of the Olga Basin region, northern Barents Sea – a link to the timanian orogeny; G-cubed, 20 (2) (2019); 10.1029/2018GC007814 Rüdiger Lutz, Peter Klitzke, Philipp Weniger, Martin Blumenberg, Dieter Franke, Lutz Reinhardt, Axel Ehrhardt, Kai Berglar; Basin and petroleum systems modelling in the northern Norwegian Barents Sea; Marine and Petroleum Geology; 2021; https://doi.org/10.1016/j.marpetgeo.2021.105128. Franke, D., Klitzke, P., Barckhausen, U., Berglar, K., Berndt, C., Damm, V., Dannowski, A., Ehrhardt, A., Engels, M., Funck, T., Geissler, W., Schnabel, M., Thorwart, M. & Trinhammer, P. (2019): Polyphase Magmatism During the Formation of the Northern East Greenland Continental Margin. - Tectonics, 38, 8: 2961–2982, DOI: 10.1029/2019tc005552.
-
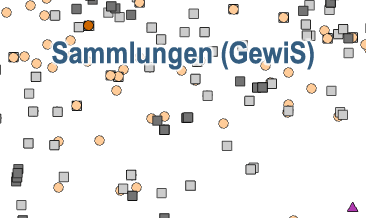
The map of the BGR geoscientific collections displays the localities of the collection‘s objects. Two different types of positions are presented: localities based on available coordinates (´Fundort erfasst´) and subsequently generated coordinates based on descriptions (´Position ermittelt´). The BGR-Geoviewer provides a link directly to the GewiS application (https://gewis.bgr.de) and thus to the description of the collection objects.
-
The map shows the distribution of potential sluiced sand north of the East Frisian Islands. There, primarily sands of medium grain size are needed for the protection of island coasts in order to compensate for the constant coastal erosion caused by rising sea levels, storm surge events and current-induced material removal and transport. The study area is limited to an area bounded on land by the -8 m NN isobath and on sea by the southern traffic separation area ("Terschelling - German Bight"). Large-scale extraction of sluiced sand is only possible down to a depth of 3 m. For future needs, local depth extractions down to a depth of 20 m below the seabed surface may have to be included in the considerations. For the evaluation of the grain size spectrum searched for, 2 maps were prepared. The observation depth differs with regard to the evaluation for a surface sampling to a depth of 3 m and a second one for depth sampling to a depth of 20 m below the seabed. Two classes were kept, showing potential occurrences of sand in the depth ranges mentioned. If the data basis is available in high quality, the general class "sand" was specified and subdivided into "fine to medium sand".
-
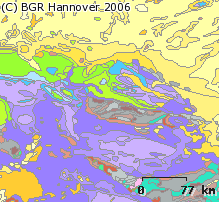
The map of gravel deposits on a scale of 1 : 250,000 shows the distribution of sediments that contain gravel. The gravel fractions in the upper 0.2 m below the seabed surface are shown over the entire area. In the depth intervals 0-1 m, 1-2 m and 2-3 m, the gravel occurrences are additionally mapped selectively, depending on the drilling data. The proportion of gravel in the sediment is subdivided into five classes, each in gradations of 20 wt.% gravel. The maps are based on sediment samples taken from the seabed surface down to a depth of 0.2 m and on layer descriptions from boreholes.
-
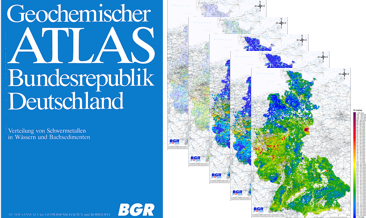
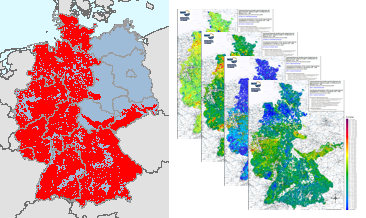
Between 1977 and 1983, the Federal Institute for Geosciences and Natural Resources (BGR) took approx. 80,000 water samples and 70,000 sediment samples from streams and rivers in several sampling campaigns on the territory of the Federal Republic of Germany at that time and examined them geochemically. In addition to the geochemical prospection of areas with potentially deposits, the aim of the investigations was also to record indications of anthropogenic environmental pollution. The results of these investigations were published in the Geochemical Atlas of the Federal Republic of Germany (Fauth et al., 1985). The data collected within the framework of the Geochemical Atlas of the Federal Republic of Germany in 1985 is a geochemical survey of the former territory of the Federal Republic of Germany which is unique in its high sampling density. All later geochemical investigations were carried out with a much lower sampling density. This valuable and irretrievable data is now being made generally available via the BGR geoportals. In addition to the digital provision of the original data material, the texts from Fauth et al. (1985) and distribution maps produced according to the method used in 1985, the data were reprocessed using modern methods. The WMS shows the distribution of the measured element concentrations and parameters in stream sediments in five different coloured point and colour shaded contour maps for each element or parameter.
-
Between 1977 and 1983, the Federal Institute for Geosciences and Natural Resources (BGR) took approx. 80,000 water samples and 70,000 sediment samples from streams and rivers in several sampling campaigns on the territory of the Federal Republic of Germany at that time and examined them geochemically. In addition to the geochemical prospection of areas with potentially deposits, the aim of the investigations was also to record indications of anthropogenic environmental pollution. The results of these investigations were published in the Geochemical Atlas of the Federal Republic of Germany (Fauth et al., 1985). The data collected within the framework of the Geochemical Atlas of the Federal Republic of Germany in 1985 is a geochemical survey of the former territory of the Federal Republic of Germany which is unique in its high sampling density. All later geochemical investigations were carried out with a much lower sampling density. This valuable and irretrievable data is now being made generally available via the BGR geoportals. In addition to the digital provision of the original data material, the texts from Fauth et al. (1985) and distribution maps produced according to the method used in 1985, the data were reprocessed using modern methods. The WMS shows the distribution of the measured element concentrations and parameters in stream waters in five different coloured point and colour shaded contour maps for each element or parameter.
-
Between 1975 and 1986, geochemical investigations were carried out by the Federal Institute for Geosciences and Natural Resources (BGR) on the territory of the then Federal Republic of Germany and by the Central Geological Institute (ZGI) of the former GDR in the area of the pre-Upper Permian bedrock units in the southern part of the former GDR, which lie on the earth's surface or are slightly covered by the Cenozoic. Approximately 98,000 water and 87,500 stream sediment samples were taken and geochemically analysed. The results of these investigations were published in the "Geochemical Atlas of the Federal Republic of Germany" (Fauth et al., 1985) and in the "Final Report on the Comparative Evaluation of the Raw Material Potential in the Bedrock Units of the GDR" (Röllig et al., 1990; in German). The geochemical data collected as part of these investigations, which cover a large part of the area of today's Federal Republic of Germany, are unique in their high sampling density. All subsequent geochemical investigations were carried out with a much lower sample density. These valuable and irretrievable data have been generally accessible via the BGR geoportal since their digital processing and provision in 2022 (Geochemical Atlas of the Federal Republic of Germany) and 2023 (Geochemical Prospection in the bedrock units in the southern part of the former GDR). However, a direct comparison of the maps produced for the two sub-areas is not possible due to the differences in the analytical methods used in the investigations (investigated element spectrum, analytical quality, determination limits, ...). Nevertheless, for some of the investigated elements and parameters it is possible to summarise the results of these geochemical investigations, which are unique in their high occupancy density, with appropriate adjustments (determination limits, representable content ranges, classification of the map legends, ...). Such summarised representations are now being made available for the first time via the BGR geoportal. The WMS shows the distribution of the measured element contents and parameters for each element or parameter in four different colored point and isosurface maps.
-
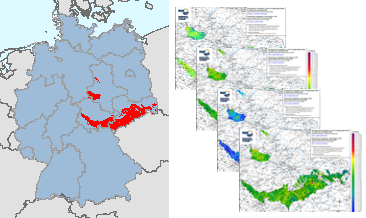
In the former GDR, investigations were carried out between 1980 and 1990 to estimate the raw material potential in the pre-Upper Permian bedrock units (Flechtingen-Rosslau Hills, Harz Mountains, Saxon Granulite Mountains, Thuringian Forest, Thuringian-Vogtlandian Slate Mountains, Ore Mountains, Elbe Valley Region/Lusatia), which lie at the earth's surface or are slightly covered by the Cenozoic. Part of these investigations was a geochemical prospection in the area of the above-mentioned bedrock units. Approximately 18,000 water and 17,500 stream sediment samples were taken and geochemically analysed over an area of almost 15,000 km². The results of these investigations were documented in sub-reports on the individual bedrock units as well as in the "Final Report on the Comparative Evaluation of the Raw Material Potential in the Bedrock Units of the GDR" (Röllig et al., 1990; in German). These data from the bedrock units in the southern part of the former GDR are unique in their high sampling density (more than 1 sample/km²) and provide a comprehensive geochemical survey of these areas. All later geochemical investigations (Geochemical Atlas 2000 as well as within the framework of GEMAS and FOREGS) were carried out with a much lower sampling density. These valuable and irretrievable data are now made generally available via the BGR geoportal. In addition to the digital provision of the original data material, area-wide distribution maps are made available for the first time, which were generated using modern computer-assisted methods. The WMS shows the distribution of the measured element concentrations and parameters in stream waters and stream sediments in four different coloured point and colour shaded contour maps for each element or parameter.
-
The 1:5 Million International Geological Map of Europe and Adjacent Areas shows the pre-Quaternary geology of Europe onshore and offshore. In addition to the geology attributed by age, petrography and genesis, also magnetic anomalies, tectonic structures, metamorphism and – in the offshore areas – information about the continental/oceanic crust and the continental margin, are shown. The map was developed by BGR under the umbrella of the Commission of the Geological Map of the World (CGMW) and in cooperation with geological surveys organisations of 48 countries and more than 20 research institutes. For detailed information about the 'IGME 5000: More than just a map – A multinational GIS Project' please visit the IGME website.