 My GeoNetwork catalogue
elevation
Provided by
Type of resources
Available actions
Topics
Keywords
Contact for the resource
Update frequencies
-
-
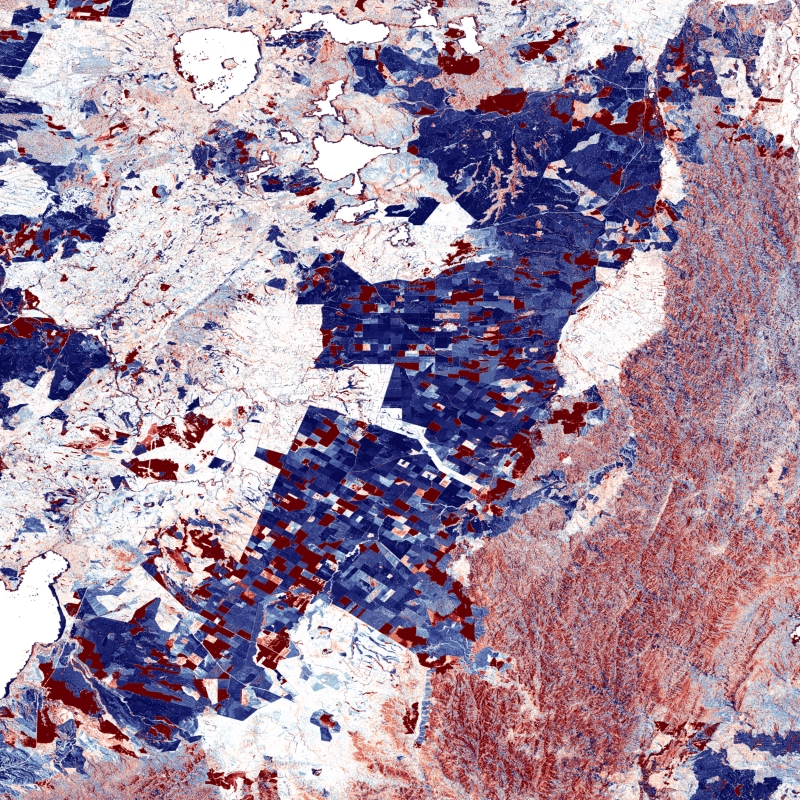
The TanDEM-X DEM Change Maps is a project developed by the Institute Remote Sensing Technology (IMF) at the German Aerospace Center (DLR) within the activities of the TanDEM-X Mission. Between 2016 and 2022, the TanDEM-X mission acquired an additional complete coverage of the Earth's landmass to deliver a temporally independent coverage within a well-defined time span. These new acquisitions not only provide more up-to-date elevation information, but also a great dataset to show the changes that have occurred during the years separating this new coverage from the coverages acquired to generate the TanDEM-X global DEM (between 2011 and 2014). This product - the TanDEM-X 30 m DEM Change Maps - shows the changes between the edited first global TanDEM-X DEM (TanDEM-X 30m Edited DEM) and the newly acquired time-tagged DEM scenes. In order to keep a unique timestamp, two change maps are available per tile: one with the change to the oldest pixel in the new dataset - the first DEM change, and another with the change to the newest pixel of the new dataset - the last DEM change. The two maps differ only when there are multiple coverages. Users must be aware that a given elevation change measured in the DEM change maps corresponds to a topographic change with respect to TanDEM-X 30m EDEM, but cannot be associated with a corresponding physical height change of the same magnitude. This is due to the fact that the global TanDEM-X DEM reflects an averaged elevation derived from the combination of different images, acquired over a period of several years but also because the radar waves penetrate differently in the surface depending on the attributes of the land cover. This is especially important over vegetated and snow-covered regions.
-

-
-
-

-
-

INSPIRE theme Elevation (bathymetry). Provision of the topography of the seabed in the North and Baltic Sea.
-
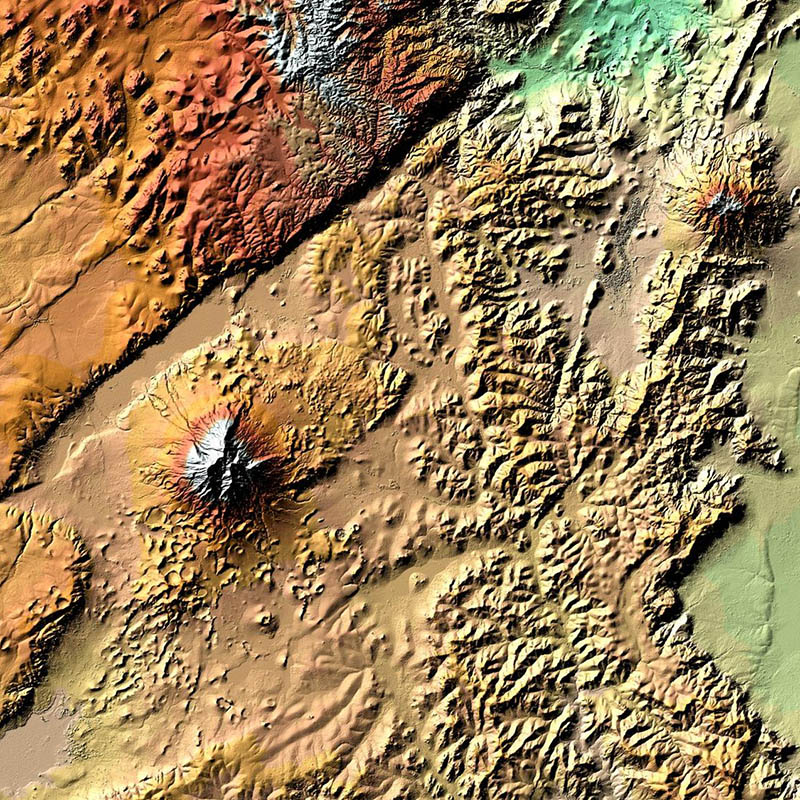
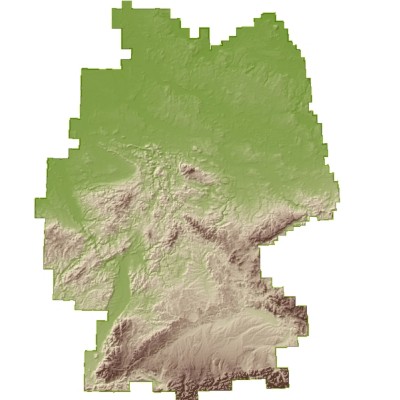
TanDEM-X (TerraSAR-X add-on for Digital Elevation Measurements) is an Earth observation radar mission that consists of a SAR interferometer built by two almost identical satellites flying in close formation. With a typical separation between the satellites of 120m to 500m a global Digital Elevation Model (DEM) has been generated. The main objective of the TanDEM-X mission is to create a precise 3D map of the Earth's land surfaces that is homogeneous in quality and unprecedented in accuracy. The data acquisition was completed in 2015 and production of the global DEM was completed in September 2016. The absolute height error is with about 1m an order of magnitude below the 10m requirement. The TanDEM-X 12m DEM is the nominal product variant of the global Digital Elevation Model (DEM) acquired in the frame of the German TanDEM-X mission between 2010 and 2015 with a spatial resolution of 0.4 arcseconds (12m at the equator). It covers all Earth’s landmasses from pole to pole. For more information concerning the TanDEM-X mission, the reader is referred to: https://www.dlr.de/dlr/en/desktopdefault.aspx/tabid-10378/
-

The Weser estuary at the German North Sea coast serves as a fairway to the harbours of Bremerhaven and Bremen. To ensure safe shipping and navigation, the navigation channel depths are nowadays intensively monitored, and have been so in the past. These are valuable data for consulting and research purposes, and enables investigations leading to a better understanding of hydrodynamics, salt intrusion and morphological processes in the estuary, in the present as well as the past. For recent years, thanks to modern monitoring techniques and digitalization, measuring data has been compiled to consistent digital terrain models of high quality and accuracy. For time periods before the 1990ies however, measurements were scarcer and the data are available only in form of printed bathymetrical and nautical charts. The objective of the project “Historical system states of the Weser estuary (HIWEST)” was to: • digitalize depths measurements starting from 1960, • georeference the data points and • process and compile them to digital terrain models that can be used for research and consulting. The project was led and financed by the Federal Waterways Engineering and Research Institute (BAW). It was supported by the Federal Maritime and Hydrographic Agency (BSH) and by the German Water and Shipping Administration (WSV) who provided printed charts and scanned data sets. The smile consulting GmbH was contracted to process the data and compile digital terrain models. One of the main challenges of the project was georeferencing. While georeferencing and projecting in the horizontal domain was comparatively straightforward, the transformation of depths below different chart datums to the Germans mean height reference system represented a challenge. This was accomplished by an algorithm considering spatial polygons provided by BSH and further meta information on the different levelling systems. The accuracy of the data sets differs depending on the quality of the original data. Since the 1990ies, powerful measurement methods such as airborne laser scanning (ALS) and multibeam echo-sounding has led to high resolutions and high data accuracy. In past surveys, the depths were measured in single-beam echo-soundings, often along individual cross sections, and there is no information between these soundings. As a result, the older terrain models are much smoother then the newer ones and contain less detailed information. More technical details can be found in the appendix of the technical report. The following digital terrain models (DTM, in the following the German abbreviation DGM is used) of the Lower and Outer Weser estuary were made available: • DGM 1966, marking the situation before deepening the Outer Weser to SKN-12 m</li> • DGM 1972, marking the situation before deepening the Lower Weser to SKN-9 m</li> • DGM 1981, marking the situation before extensive river works in the Lower Weser</li> • DGM 1996, marking the situation before deepening the Outer Weser to SKN-14 m</li> • DGM 2002, marking the situation after deepening the Outer Weser to SKN-14 m, reference digital terrain model. The years were chosen so they would represent consistent periods not affected by constructive engineering measures such as channel deepenings, and secondly based on optimal data availability. Each data set however consists not only of data from the respective year, but data had to be added from adjacent years. To close gaps, data from recent surveys were used. The data sets span the whole estuary from the North Sea to the tidal weir in the city of Bremen and are available as 1x1 m raster data sets. How to cite the HIWEST data: <strong style="color: red;"> The data set is only to be quoted together with the Technical Report.</strong> Report: Bundesanstalt für Wasserbau (2020): Historical digital terrain models of the Weser Estuary (HIWEST). Technical Report B3955.02.04.70168-6. Bundesanstalt für Wasserbau. https://henry.baw.de/handle/20.500.11970/107521 Data set: Bundesanstalt für Wasserbau (2020): Historical digital terrain model data of the Weser Estuary (HIWEST) [Data set]. Bundesanstalt für Wasserbau. https://doi.org/10.48437/02.2020.K2.5200.0001