 My GeoNetwork catalogue
Sentinel-1
Provided by
Type of resources
Available actions
Topics
Keywords
Contact for the resource
Update frequencies
Service types
-
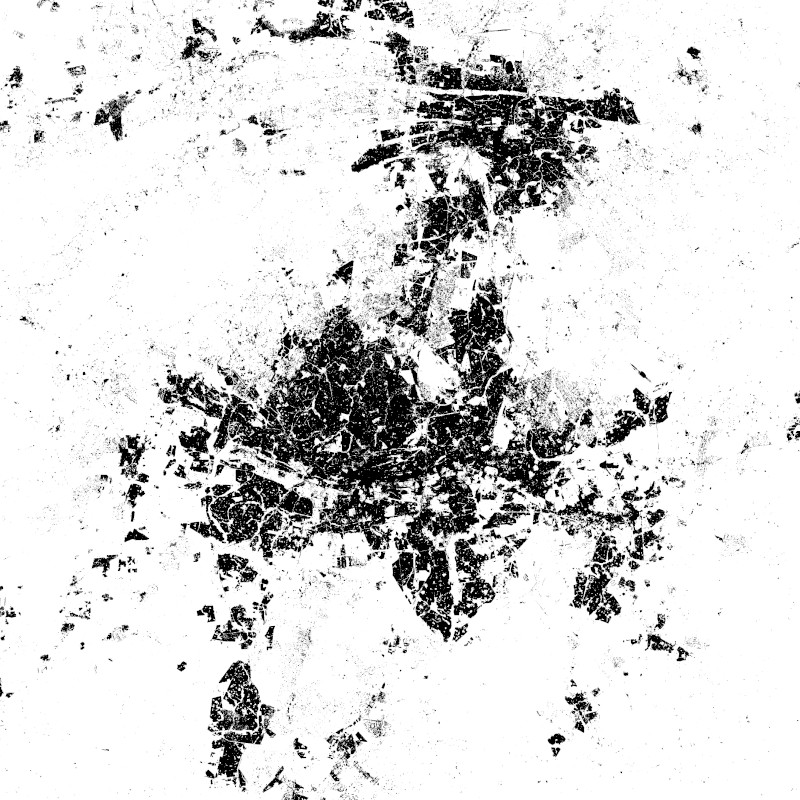
The World Settlement Footprint WSF 2015 version 2 (WSF2015 v2) is a 10m resolution binary mask outlining the extent of human settlements globally for the year 2015. Specifically, the WSF2015 v2 is a pilot product generated by combining multiple datasets, namely: • The WSF2015 v1 derived at 10m spatial resolution by means of 2014-2015 multitemporal Landsat-8 and Sentinel-1 imagery (of which ~217K and ~107K scenes have been processed, respectively); https://doi.org/10.1038/s41597-020-00580-5 • The High Resolution Settlement Layer (HRSL) generated by the Connectivity Lab team at Facebook through the employment of 2016 DigitalGlobe VHR satellite imagery and publicly released at 30m spatial resolution for 214 countries; https://arxiv.org/pdf/1712.05839.pdf • The novel WSF2019 v1 derived at 10m spatial resolution by means of 2019 multitemporal Sentinel-1 and Sentinel-2 imagery (of which ~ 1.2M and ~1.8M scenes have been processed, respectively); https://doi.org/10.1553/giscience2021_01_s33 The WSF2015 v1 demonstrated to be highly accurate, outperforming all similar existing global layers; however, the use of Landsat imagery prevented a proper detection of very small structures, mostly due to their reduced scale. Based on an extensive qualitative assessment, wherever available the HRSL layer shows instead a systematic underestimation of larger settlements, whereas it proves particularly effective in identifying smaller clusters of buildings down to single houses, thanks to the employment of 2016 VHR imagery. The WSF2015v v2 has been then generated by: i) merging the WSF2015 v1 and HRSL (after resampling to 10m resolution and disregarding the population density information attached); and ii) masking the outcome by means of the WSF2019 product, which exhibits even higher detail and accuracy, also thanks to the use of Sentinel-2 data and the proper employment of state-of-the-art ancillary datasets (which allowed, for instance, to effectively mask out all roads globally from motorways to residential).
-
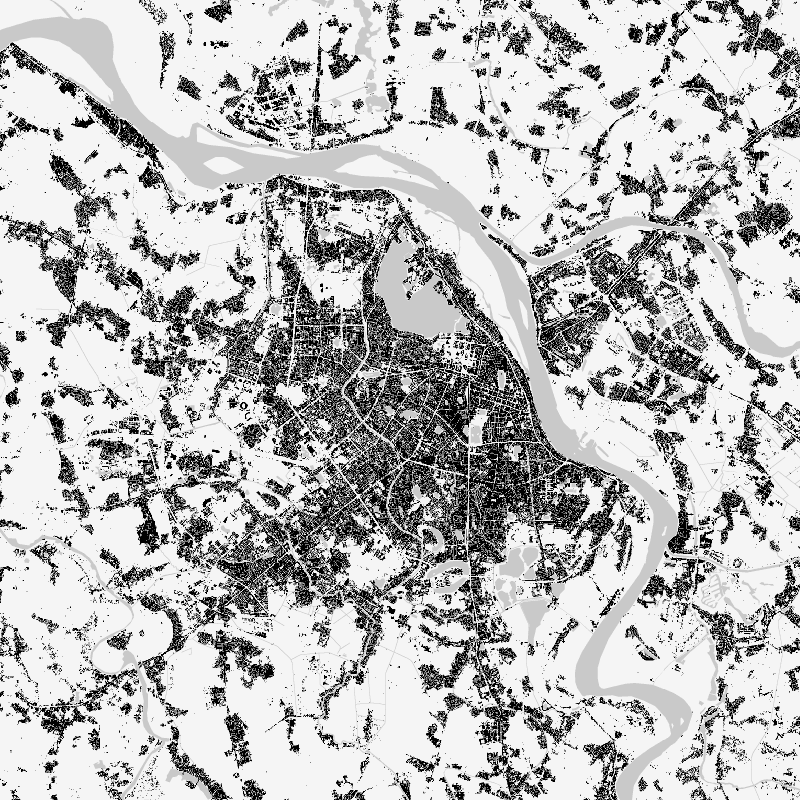
The World Settlement Footprint (WSF) 2019 is a 10m resolution binary mask outlining the extent of human settlements globally derived by means of 2019 multitemporal Sentinel-1 (S1) and Sentinel-2 (S2) imagery. Based on the hypothesis that settlements generally show a more stable behavior with respect to most land-cover classes, temporal statistics are calculated for both S1- and S2-based indices. In particular, a comprehensive analysis has been performed by exploiting a number of reference building outlines to identify the most suitable set of temporal features (ultimately including 6 from S1 and 25 from S2). Training points for the settlement and non-settlement class are then generated by thresholding specific features, which varies depending on the 30 climate types of the well-established Köppen Geiger scheme. Next, binary classification based on Random Forest is applied and, finally, a dedicated post-processing is performed where ancillary datasets are employed to further reduce omission and commission errors. Here, the whole classification process has been entirely carried out within the Google Earth Engine platform. To assess the high accuracy and reliability of the WSF2019, two independent crowd-sourcing-based validation exercises have been carried out with the support of Google and Mapswipe, respectively, where overall 1M reference labels have been collected based photointerpretation of very high-resolution optical imagery.
-

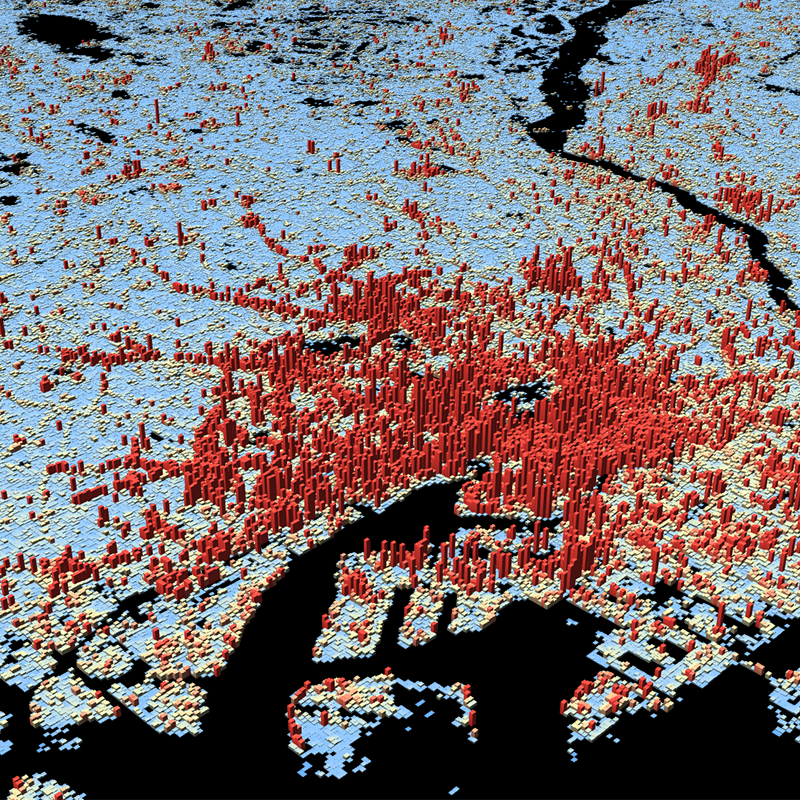
The World Settlement Footprint (WSF) 3D provides detailed quantification of the average height, total volume, total area and the fraction of buildings at 90 m resolution at a global scale. It is generated using a modified version of the World Settlement Footprint human settlements mask derived from Sentinel-1 and Sentinel-2 satellite imagery in combination with digital elevation data and radar imagery collected by the TanDEM-X mission. The framework includes three basic workflows: i) the estimation of the mean building height based on an analysis of height differences along potential building edges, ii) the determination of building fraction and total building area within each 90 m cell, and iii) the combination of the height information and building area in order to determine the average height and total built-up volume at 90 m gridding. In addition, global height information on skyscrapers and high-rise buildings provided by the Emporis database is integrated into the processing framework, to improve the WSF 3D Building Height and subsequently the Building Volume Layer. A comprehensive validation campaign has been performed to assess the accuracy of the dataset quantitatively by using VHR 3D building models from 19 globally distributed regions (~86,000 km2) as reference data. The WSF 3D standard layers are provided in the format of Lempel-Ziv-Welch (LZW)-compressed GeoTiff files, with each file - or image tile - covering an area of 1 x 1 ° geographical lat/lon at a geometric resolution of 2.8 arcsec (~ 90 m at the equator). Following the system established by the TDX-DEM mission, the latitude resolution is decreased in multiple steps when moving towards the poles to compensate for the reduced circumference of the Earth.
-
This dataset is a derivative of the WSF3D raster dataset tailored for the web. As a tiled vector dataset, it enables dynamic client-side visualization of the WSF3D metrics
-

The SAR4Tectonics project aims to provide open-access, global measurements of ground deformation in high-strain areas near tectonic plate boundaries. By leveraging the capabilities of the Persistent and Distributed Scatterer (PS/DS) technique with Sentinel-1 SAR images, the project seeks to deliver comprehensive and accurate data on ground deformation, which is crucial for understanding geological processes, assessing seismic risks in these regions, and advance our understanding of Earth's dynamic processes in general. The PS/DS technique offers significantly denser spatial coverage than GNSS, enabling the detection of more localized deformation signals. For the first time, such a vast and detailed dataset is made publicly available. By making this data openly accessible, the SAR4Tectonics project hopes to reduce the burden of SAR data processing for geoscientists, facilitating future studies.The project involved processing 6.5 years of SAR data, focusing on areas where the second invariant of strain exceeds 3 nanostrain per year. Various error corrections were employed, including tropospheric delay correction using ECMWF reanalysis data, ionospheric mitigation via CODE total electron content maps, and solid earth tide modeling. Additionally, the impact of vegetation and soil moisture on distributed scatterers was minimized through a full covariance matrix (phase linking) approach, and the results were calibrated using GNSS data. The final dataset includes line-of-sight average velocity maps, deformation time series, projection vectors, and reference plate modeled velocities.
-
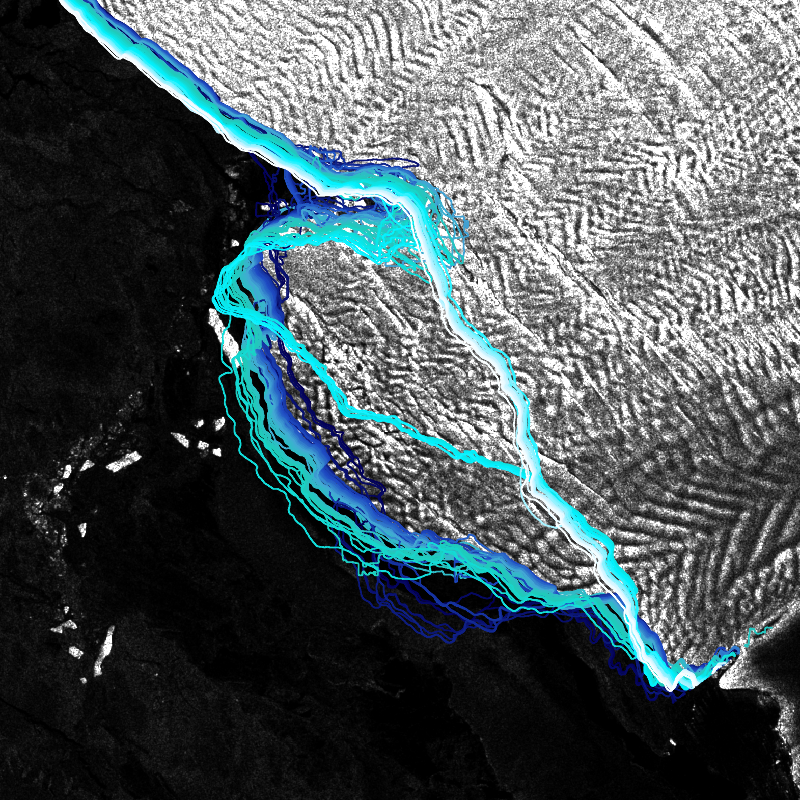
IceLines (Ice Shelf and Glacier Front Time Series) is an automated calving front monitoring service providing monthly ice shelf front time series of major Antarctic ice shelves. The provided time series allows to discover the dynamics of ice shelf front changes and calving events. The front positions are automatically derived from Sentinel-1 data based on a deep neuronal network called HED-U-Net. The time series covers the timespan 2014 to today (partly limited due to Sentinel-1 data availability). Incorrectly extracted fronts are truncated which might lead to gaps in the time series especially between December to March due to strong surface melt. Annual averages are calculated based on the extracted monthly fronts (excluding the summer months) and provide more robust results due to temporal aggregation
-

SWIM Water Extent is a global surface water product at 10 m pixel spacing based on Sentinel-1/2 data. The collection contains binary layers indicating open surface water for each Sentinel-1/2 scene. Clouds and cloud shadows are removed using ukis-csmask (see: https://github.com/dlr-eoc/ukis-csmask ) and are represented as NoData. The water extent extraction is based on convolutional neural networks (CNN). For further information, please see the following publications: https://doi.org/10.1016/j.rse.2019.05.022 and https://doi.org/10.3390/rs11192330
-

The World Settlement Footprint (WSF) 3D provides detailed quantification of the average height, total volume, total area and the fraction of buildings at 90 m resolution at a global scale. It is generated using a modified version of the World Settlement Footprint human settlements mask derived from Sentinel-1 and Sentinel-2 satellite imagery in combination with digital elevation data and radar imagery collected by the TanDEM-X mission. The framework includes three basic workflows: i) the estimation of the mean building height based on an analysis of height differences along potential building edges, ii) the determination of building fraction and total building area within each 90 m cell, and iii) the combination of the height information and building area in order to determine the average height and total built-up volume at 90 m gridding. In addition, global height information on skyscrapers and high-rise buildings provided by the Emporis database is integrated into the processing framework, to improve the WSF 3D Building Height and subsequently the Building Volume Layer. A comprehensive validation campaign has been performed to assess the accuracy of the dataset quantitatively by using VHR 3D building models from 19 globally distributed regions (~86,000 km2) as reference data. The WSF 3D standard layers are provided in the format of Lempel-Ziv-Welch (LZW)-compressed GeoTiff files, with each file - or image tile - covering an area of 1 x 1 ° geographical lat/lon at a geometric resolution of 2.8 arcsec (~ 90 m at the equator). Following the system established by the TDX-DEM mission, the latitude resolution is decreased in multiple steps when moving towards the poles to compensate for the reduced circumference of the Earth.
-
The product shows forest structure information on canopy height, total canopy cover and Above-ground biomass density (AGBD) in Germany as annual products in 10 m spatial resolution. The products were generated using a machine learning modelling approach that combines complementary spaceborne remote sensing sensors, namely GEDI (Global Ecosystem Dynamics Investigation; NASA; full-waveform LiDAR), Sentinel-1 (Synthetic-Aperture-Radar; ESA, C-band) and Sentinel-2 (Multispectral Instrument; ESA; VIS-NIR-SWIR). Sample estimates on forest structure from GEDI were modelled in 10 m spatial resolution as annual products based on spatio-temporal composites from Sentinel-1 and -2. The derived products are the first consistent data sets on canopy height, total canopy cover and AGBD for Germany which enable a quantitative assessment of recent forest structure dynamics, e.g. in the context of repeated drought events since 2018. The full description of the method and results can be found in the publication of Kacic et al. (2023).