Topic
farming
871 record(s)
Provided by
Type of resources
Available actions
Topics
Keywords
Contact for the resource
Update frequencies
-

Hedgerows play an important role in maintaining biodiversity, carbon sequestration, soil stability and the ecological integrity of agricultural landscapes. In this dataset, hedgerows are mapped for the whole of Bavaria. Orthophotos with a spatial resolution of 20 cm, taken in the period from 2019 to 2021, were used in a deep learning approach. Hedgerow polygons of the Bavarian in-situ biotope mapping from 5 districts (Miltenberg, Hassberge, Dillingen a.d. Donau, Freyung-Grafenau, Weilheim-Schongau) as well as other manually digitized polygons were used for training and testing as input into a DeepLabV3 Convolutional Neural Network (CNN). The CNN has a Resnet50 backbone and was optimized with the Dice loss as a cost function. The generated hedgerow probability tiles were post-processed by merging and averaging the overlapping tile boundaries, shape simplification and filtering. For more details, see Huber Garcia et al. (2025). The dataset has been created within the project FPCUP (https://www.copernicus-user-uptake.eu/) in close cooperation with Bayerisches Landesamt für Umwelt (LfU).
-

This raster dataset shows the main type of crop grown on each field in Germany each year. Crop types and crop rotation are of great economic importance and have a strong influence on the functions of arable land and ecology. Information on the crops grown is therefore important for many environmental and agricultural policy issues. With the help of satellite remote sensing, the crops grown can be recorded uniformly for whole Germany. Based on Sentinel-1 and Sentinel-2 time series as well as LPIS data from some Federal States of Germany, 18 different crops or crop groups were mapped per pixel with 10 m resolution for Germany on an annual basis since 2017. These data sets enable a comparison of arable land use between years and the derivation of crop rotations on individual fields. More details and the underlying (in the meantime slightly updated) methodology can be found in Asam et al. 2022.
-

Grassland mowing dynamics (i.e. the timing and frequency of mowing events) have a strong impact on grassland functions and yields. As grasslands in Germany are managed on small-scale units and grass grows back quickly, satellite information with high spatial and temporal resolution is necessary to capture grassland mowing dynamics. Based on Sentinel-2 data time series, mowing events are detected throughout Germany and annual maps of the grassland mowing frequency generated. The grassland mowing detection approach operates per pixel, including preprocessing of the Enhanced Vegetation Index (EVI) time series and a calibrated rule-based grassland mowing detection which is specified in more detail in Reinermann et al. 2022, 2023.
-

-
-
-
-
-

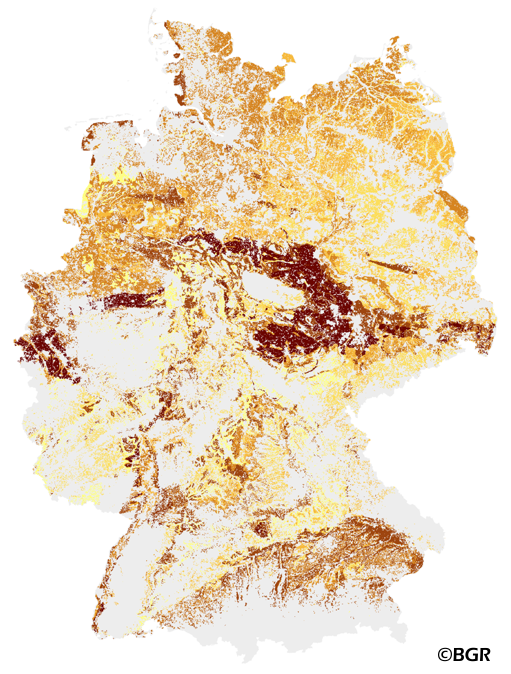
The Muencheberg Soil Quality Rating (SQR) was developed by the Leibniz Centre for Agricultural Landscape Research (ZALF). SQR describes the suitability of sites under agricultural land use and helps to estimate the yield potential of sites at a global scale. This method was especially adapted for application with soil maps by the Federal Institute of Geosciences and Resources BGR and is published in the documentation of Ad-hoc-AG Boden (representing the soil experts of the geological services of the German federal states). The map shows the SQR for cropland in Germany based on the landuse stratified soilmap of Germany at scale 1:1,000,000. Climate (DWD), Relief (BKG) and landuse data (CLC2006) are used as input data in addition to the soil map. SQR consists of a series of pedotransfer rules. First, eight basic soil properties are weighted and combined to describe the soil (substrate, rooting depth, etc.). Next, hazard indicators are derived (drought risk, soil depth above solid rock). These indicators are critical for farming and limit the overall soil quality. Only those hazard indicators were selected for SQR which have the greatest effect on potential grain yield. The final SQR-score ranges from about 0 to 102 points.
-
 www.geodatenkatalog.de (S1L)