 My GeoNetwork catalogue
biota
Provided by
Type of resources
Available actions
Topics
Keywords
Contact for the resource
Update frequencies
-
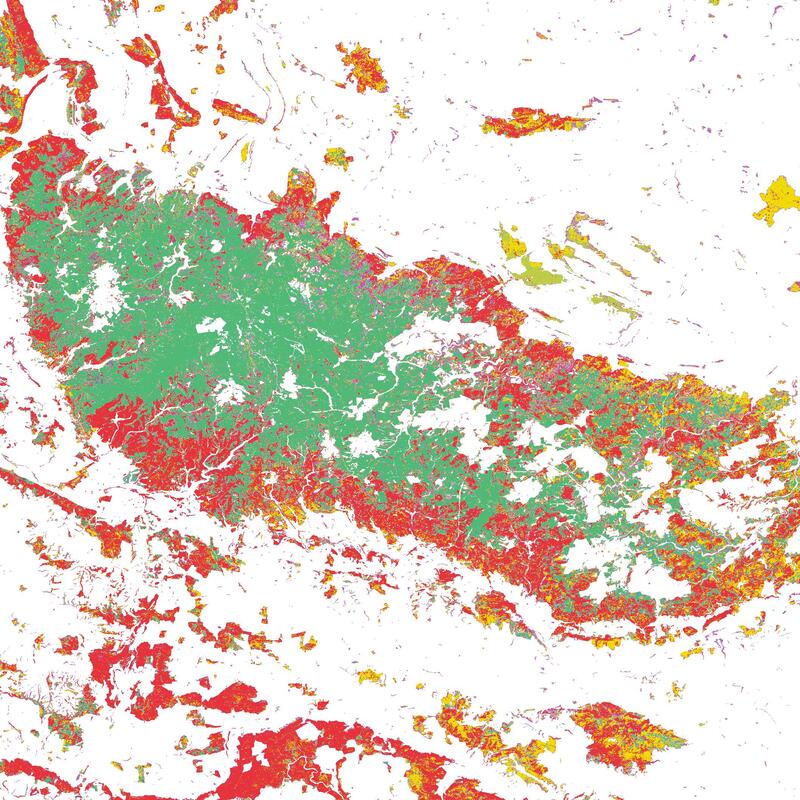
The Tree Species Germany product provides a map of dominant tree species across Germany for the year 2016 at a spatial resolution of 10 meters. The map depicts the distribution of ten tree species groups derived from multi-temporal optical Sentinel-2 data. The input features explicitly incorporate phenological information to capture seasonal vegetation dynamics relevant for species discrimination. A total of over 100,000 training and test samples were compiled from publicly accessible sources, including urban tree inventories, Google Earth Pro, Google Street View, and field observations. The final product was created by majority-voting on annual XGBoost Sentinel-2 tree species classifications (2016–2024) and filtering with forest structure data. If no clear majority vote was achieved, the class uncertain was assigned. The Tree Species Germany 2016 product achieves an overall F1-score of 0.95. For the dominant species pine, spruce, beech, and oak, class-wise F1-scores range from 0.92 to 0.99, while F1-scores for other widespread species such as birch, alder, larch, Douglas fir, fir, and other deciduous species range from 0.85 to 0.96. The product provides a consistent, high-resolution, and up-to-date representation of tree species distribution across Germany. Its transferable, cost-efficient, and repeatable methodology enables reliable large-scale forest monitoring and offers a valuable basis for assessing spatial patterns and temporal changes in forest composition in the context of ongoing climatic and environmental dynamics.
-

The dataset is based on the analysis of forest cover dynamics in the Paraguayan Chaco (northeastern part of Paraguay) between 1987 and 2020. The underlying forest masks were derived through annual forst classifications with a Random-Forest-Classifier trained on Landsat data from 1987 until 2020. The map shows the year in which the forest area was lost.
-
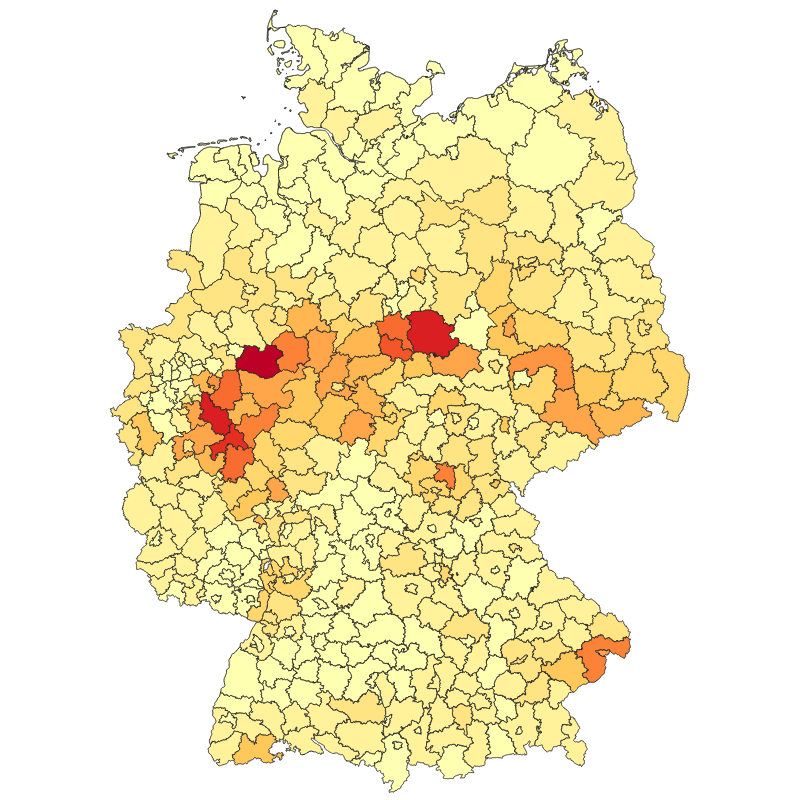
The product contains information of tree canopy cover loss in Germany per district (Landkreis) between January 2018 and April 2021 at monthly temporal resolution. The information is aggregated at from the 10 m spatial resolution Sentinel-2 and Landsat-based raster product (Tree Canopy Cover Loss Monthly - Landsat-8/Sentinel-2 - Germany, 2018-2021). The method used to derive this product as well as the mapping results are described in detail in Thonfeld et al. (2022). The map depicts areas of natural disturbances (windthrow, fire, droughts, insect infestation) as well as sanitation and salvage logging, and regular forest harvest without explicitly differentiating these drivers. The vector files contain information about tree canopy cover loss area per forest type (deciduous, coniferous, both) and per year (2018, 2019, 2020, January-April 2021, and January 2018-April 2021) in absolute numbers and in percentages. In addition, the vector files contain the district area and the total forest area per district.
-

-

This vector dataset is based on a 10 m resolution raster dataset that shows forest canopy cover loss (FCCL) in Germany at a monthly resolution from September 2017 to September 2024. Results at pixel level were aggregated at municipality, district, and federal state level. For the results at administrative level we differentiate between deciduous and coniferous forests. We use the stocked area map 2018 (Langner et al. 2022, https://doi.org/10.3220/DATA20221205151218 ) as a reference forest mask. We differentiate between deciduous and coniferous forests by intersecting the stocked area map with a tree species map (Blickensdoerfer et al. 2024). Pixels of the classes birch, beech, oak, alder, deciduous trees with long lifespan and deciduous trees with short lifespan were classified as deciduous forest and pixels of the classes Douglas fir, spruce, pine, larch and fir as coniferous forest. The coverage of the two datasets is not identical, which is why a few areas of the forest reference map remained unclassified. These were filled with the dominant leaf type map of the Copernicus Land Monitoring Service (CLMS 2025). Therefore, the vector data at administrative level contains information about unclassified forest areas and the total forest area as the sum of deciduous, coniferous, and unclassified forests. The FCCL confidence at pixel level is lowest at the end of the time series because the number of repeated threshold exceedance is used as a criterion to record forest canopy cover losses. Therefore, we excluded July 2024 through September 2024 from the annual and overall statistics and summarized the respective FCCL as additional attribute. The dataset is a fully reprocessed continuation of the assessment in Thonfeld et al. (2022).
-

This product is a vector file of the districts of the Paraguayan Chaco. It contains information on the forest cover within each district for the years 1986 until 2020. Hence, this product aggregates the information of 34 annual forest maps of the Paraguayan Chaco to a district level and provides the basis for further analysis as conducted in the following publication: https://doi.org/10.3390/f13010025
-

This raster dataset shows forest canopy cover loss (FCCL) in Germany at a monthly resolution from September 2017 to October 2025. It is similar to the product developed by Thonfeld et al. (2022) but was fully reprocessed and updated to reveal the most recent forest disturbance dynamics (Thonfeld et al. 2026). The combination of Sentinel-2A/B and Landsat-8/9 data allows for a high temporal resolution while the pixel size of the product is 10 m. The results are clipped to the stocked area 2018 mapped by the Thünen-Institute (Langner et al. 2022, https://doi.org/10.3220/DATA20221205151218). The dataset contains predominantly larger canopy openings resulting from different drivers but also larger clusters of standing deadwood. FCCL can result from abiotic (e.g. wind, fire, drought, hail) drivers, biotic (e.g. insects, funghi) drivers or a combination of both as well as from sanitary and salvage logging and planned harvest. The first version with canopy cover losses from January 2018 - April 2021 (Thonfeld et al. 2022) can be accessed here: https://geoservice.dlr.de/web/datasets/tccl.
-
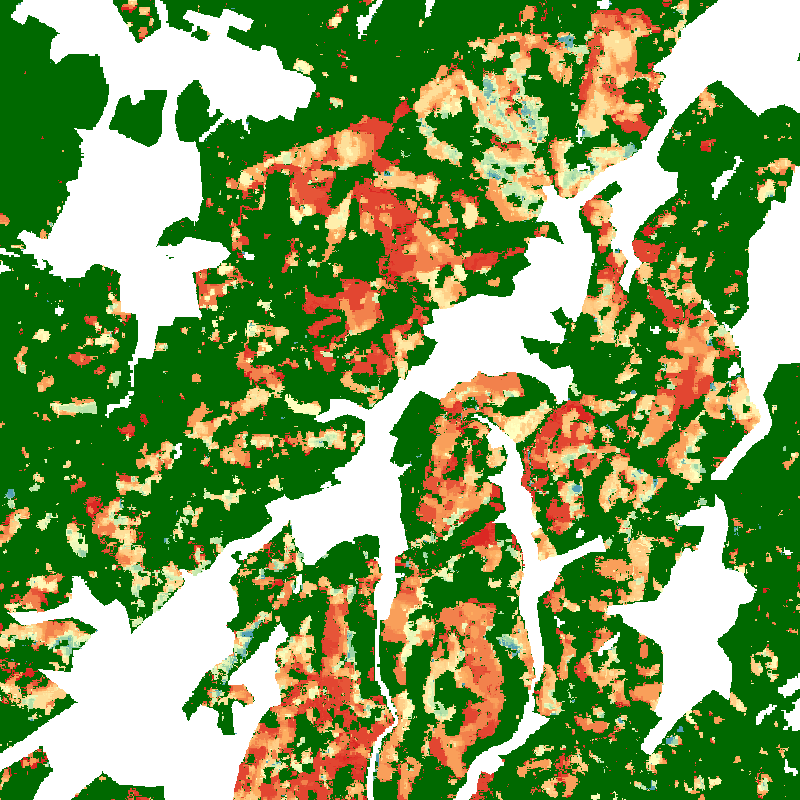
The product shows tree canopy cover loss in Germany between January 2018 and April 2021 at monthly temporal and 10 m spatial resolution. The basic principle behind this map is to compute monthly composites of the disturbance index (DI, Healey et al. 2005), a spectral index sensitive to forest disturbance, from all available Sentinel-2 and Landsat-8 data with less than 80 % cloud cover. These monthly composites are then compared to a median composite of the DI for 2017, which serves as a reference. After applying a threshold to the difference image, the time series of detected losses is checked for consistency. Only losses recorded continuously in all observations of a pixel until the end of the time series are considered. The dataset does not differentiate between the drivers of the losses. It depicts areas of natural disturbances (windthrow, fire, droughts, insect infestation) as well as sanitation and salvage logging, and regular forest harvest. The full description of the method and results can be found in Thonfeld et al. (2022).
-
-

The Tree Species Germany product provides a map of dominant tree species across Germany for the year 2022 at a spatial resolution of 10 meters. The map depicts the distribution of ten tree species groups derived from multi-temporal optical Sentinel-2 data, radar data from Sentinel-1, and a digital elevation model. The input features explicitly incorporate phenological information to capture seasonal vegetation dynamics relevant for species discrimination. A total of over 80,000 training and test samples were compiled from publicly accessible sources, including urban tree inventories, Google Earth Pro, Google Street View, and field observations. The final classification was generated using an XGBoost machine learning algorithm. The Tree Species Germany product achieves an overall F1-score of 0.89. For the dominant species pine, spruce, beech, and oak, class-wise F1-scores range from 0.76 to 0.98, while F1-scores for other widespread species such as birch, alder, larch, Douglas fir, and fir range from 0.88 to 0.96. The product provides a consistent, high-resolution, and up-to-date representation of tree species distribution across Germany. Its transferable, cost-efficient, and repeatable methodology enables reliable large-scale forest monitoring and offers a valuable basis for assessing spatial patterns and temporal changes in forest composition in the context of ongoing climatic and environmental dynamics.