From 1 - 10 / 31
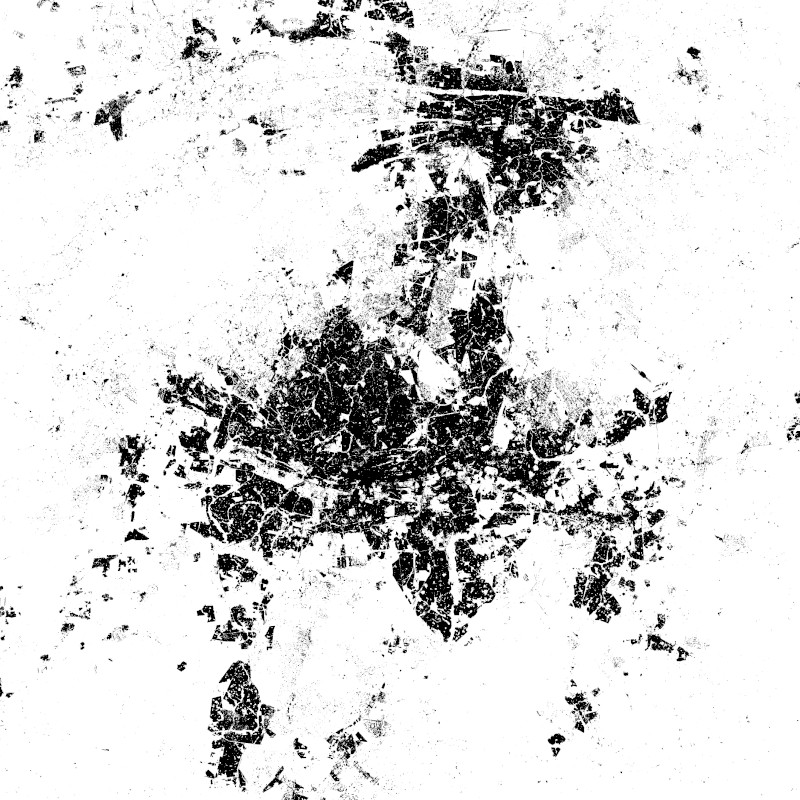
  • The World Settlement Footprint WSF 2015 version 2 (WSF2015 v2) is a 10m resolution binary mask outlining the extent of human settlements globally for the year 2015. Specifically, the WSF2015 v2 is a pilot product generated by combining multiple datasets, namely: • The WSF2015 v1 derived at 10m spatial resolution by means of 2014-2015 multitemporal Landsat-8 and Sentinel-1 imagery (of which ~217K and ~107K scenes have been processed, respectively); https://doi.org/10.1038/s41597-020-00580-5 • The High Resolution Settlement Layer (HRSL) generated by the Connectivity Lab team at Facebook through the employment of 2016 DigitalGlobe VHR satellite imagery and publicly released at 30m spatial resolution for 214 countries; https://arxiv.org/pdf/1712.05839.pdf • The novel WSF2019 v1 derived at 10m spatial resolution by means of 2019 multitemporal Sentinel-1 and Sentinel-2 imagery (of which ~ 1.2M and ~1.8M scenes have been processed, respectively); https://doi.org/10.1553/giscience2021_01_s33 The WSF2015 v1 demonstrated to be highly accurate, outperforming all similar existing global layers; however, the use of Landsat imagery prevented a proper detection of very small structures, mostly due to their reduced scale. Based on an extensive qualitative assessment, wherever available the HRSL layer shows instead a systematic underestimation of larger settlements, whereas it proves particularly effective in identifying smaller clusters of buildings down to single houses, thanks to the employment of 2016 VHR imagery. The WSF2015v v2 has been then generated by: i) merging the WSF2015 v1 and HRSL (after resampling to 10m resolution and disregarding the population density information attached); and ii) masking the outcome by means of the WSF2019 product, which exhibits even higher detail and accuracy, also thanks to the use of Sentinel-2 data and the proper employment of state-of-the-art ancillary datasets (which allowed, for instance, to effectively mask out all roads globally from motorways to residential).
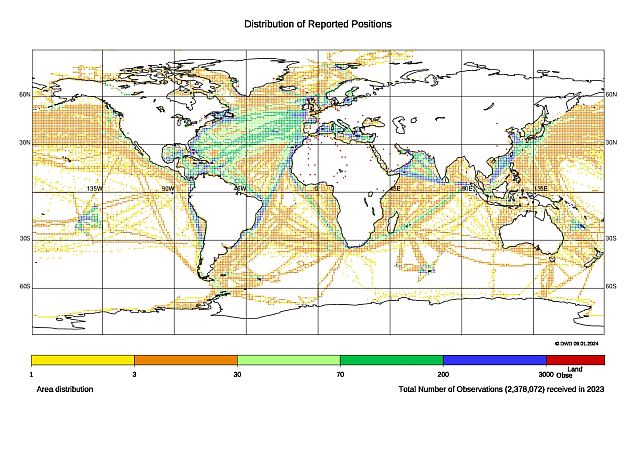
  • Global maps of anomalies of monthly mean surface air pressure derived from GME model data (reference period 1961-1990), WMO RA VI Regional Climate Centre (RCC) on Climate Monitoring

  • Global maps of mean surface air pressure (means and anomalies) derived from GME model data, provided by WMO RA VI Regional Climate Centre (RCC) an Climate Monitoring

  • Global maps of monthly normals 1961-1990 of surface air pressure derived from GME model data, provided by WMO RA VI Regional Climate Centre (RCC) on Climate Monitoring

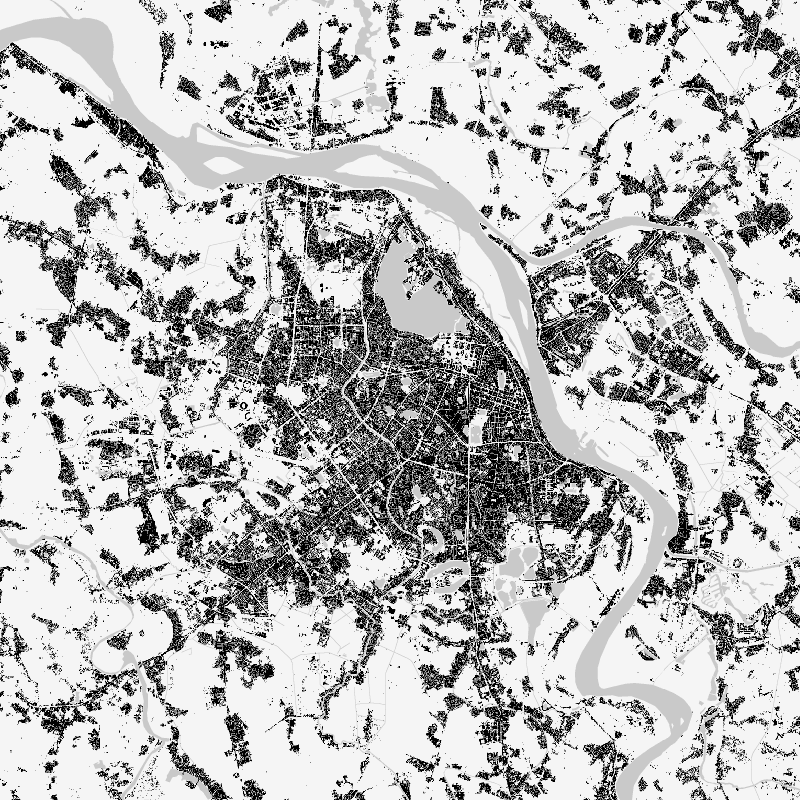
  • The World Settlement Footprint (WSF) 2019 is a 10m resolution binary mask outlining the extent of human settlements globally derived by means of 2019 multitemporal Sentinel-1 (S1) and Sentinel-2 (S2) imagery. Based on the hypothesis that settlements generally show a more stable behavior with respect to most land-cover classes, temporal statistics are calculated for both S1- and S2-based indices. In particular, a comprehensive analysis has been performed by exploiting a number of reference building outlines to identify the most suitable set of temporal features (ultimately including 6 from S1 and 25 from S2). Training points for the settlement and non-settlement class are then generated by thresholding specific features, which varies depending on the 30 climate types of the well-established Köppen Geiger scheme. Next, binary classification based on Random Forest is applied and, finally, a dedicated post-processing is performed where ancillary datasets are employed to further reduce omission and commission errors. Here, the whole classification process has been entirely carried out within the Google Earth Engine platform. To assess the high accuracy and reliability of the WSF2019, two independent crowd-sourcing-based validation exercises have been carried out with the support of Google and Mapswipe, respectively, where overall 1M reference labels have been collected based photointerpretation of very high-resolution optical imagery.

  • Global maps of monthly mean surface air pressure derived from GME model data , WMO RA VI Regional Climate Centre (RCC) on Climate Monitoring

  • The "Major River Basins of the World" is an ongoing GIS project of the Global Runoff Data Centre (GRDC) that aims at the provision of a set of shape files for the use with Geographic Information Systems (GIS). This dataset was created for the generation of GRDC map products and will be updated from time to time whenever extensions are required by future GRDC projects. At present the dataset comprises the GIS layer of 405 river basins and 687 associated rivers. GRDC data will only be provided for non-commercial uses.

  • This product shows the snow cover duration for a hydrological year. Its beginning differs from the calendar year, since some of the precipitation that falls in late autumn and winter falls as snow and only drains away when the snow melts in the following spring or summer. The meteorological seasons are used for subdivision and the hydrological year begins in autumn and ends in summer. The snow cover duration is made available for three time periods: the snow cover duration for the entire hydrological year (SCD), the early snow cover duration (SCDE), which extends from autumn to midwinter (), and the late snow cover duration (SCDL), which in turn extends over the period from mid-winter to the end of summer. For the northern hemisphere SCD lasts from September 1st to August 31st, for the southern hemisphere it lasts from March 1st to February 28th/29th. The SCDE lasts from September 1st to January 14th in the northern hemisphere and from March 1st to July 14th in the southern hemisphere. The SCDL lasts from January 15th to August 31st in the northern hemisphere and from July 15th to February 28th/29th in the southern hemisphere. The “Global SnowPack” is derived from daily, operational MODIS snow cover product for each day since February 2000. Data gaps due to polar night and cloud cover are filled in several processing steps, which provides a unique global data set characterized by its high accuracy, spatial resolution of 500 meters and continuous future expansion. It consists of the two main elements daily snow cover extent (SCE) and seasonal snow cover duration (SCD; full and for early and late season). Both parameters have been designated by the WMO as essential climate variables, the accurate determination of which is important in order to be able to record the effects of climate change. Changes in the largest part of the cryosphere in terms of area have drastic effects on people and the environment. For more information please also refer to: Dietz, A.J., Kuenzer, C., Conrad, C., 2013. Snow-cover variability in central Asia between 2000 and 2011 derived from improved MODIS daily snow-cover products. International Journal of Remote Sensing 34, 3879–3902. https://doi.org/10.1080/01431161.2013.767480 Dietz, A.J., Kuenzer, C., Dech, S., 2015. Global SnowPack: a new set of snow cover parameters for studying status and dynamics of the planetary snow cover extent. Remote Sensing Letters 6, 844–853. https://doi.org/10.1080/2150704X.2015.1084551 Dietz, A.J., Wohner, C., Kuenzer, C., 2012. European Snow Cover Characteristics between 2000 and 2011 Derived from Improved MODIS Daily Snow Cover Products. Remote Sensing 4. https://doi.org/10.3390/rs4082432 Dietz, J.A., Conrad, C., Kuenzer, C., Gesell, G., Dech, S., 2014. Identifying Changing Snow Cover Characteristics in Central Asia between 1986 and 2014 from Remote Sensing Data. Remote Sensing 6. https://doi.org/10.3390/rs61212752 Rößler, S., Witt, M.S., Ikonen, J., Brown, I.A., Dietz, A.J., 2021. Remote Sensing of Snow Cover Variability and Its Influence on the Runoff of Sápmi’s Rivers. Geosciences 11, 130. https://doi.org/10.3390/geosciences11030130

  • This product shows the mean snow cover duration (SCDmean), which is updated each year and consists of the arithmetic mean for the entire time series since the hydrological year 2001. The hydrological year begins in the meteorological autumn (October 1 of the previous year in the northern hemisphere or March 1 of the reference year in the southern hemisphere) and ends with the meteorological summer (northern hemisphere: August 31 of the reference year; southern hemisphere: February 28/29 of the following year). Analogous to the annual products for snow cover duration, the entire year as well as the early season (until mid-winter) and the late season (from mid-winter) are taken into account here. The “Global SnowPack” is derived from daily, operational MODIS snow cover product for each day since February 2000. Data gaps due to polar night and cloud cover are filled in several processing steps, which provides a unique global data set characterized by its high accuracy, spatial resolution of 500 meters and continuous future expansion. It consists of the two main elements daily snow cover extent (SCE) and seasonal snow cover duration (SCD; full and for early and late season). Both parameters have been designated by the WMO as essential climate variables, the accurate determination of which is important in order to be able to record the effects of climate change. Changes in the largest part of the cryosphere in terms of area have drastic effects on people and the environment. For more information please also refer to: Dietz, A.J., Kuenzer, C., Conrad, C., 2013. Snow-cover variability in central Asia between 2000 and 2011 derived from improved MODIS daily snow-cover products. International Journal of Remote Sensing 34, 3879–3902. https://doi.org/10.1080/01431161.2013.767480 Dietz, A.J., Kuenzer, C., Dech, S., 2015. Global SnowPack: a new set of snow cover parameters for studying status and dynamics of the planetary snow cover extent. Remote Sensing Letters 6, 844–853. https://doi.org/10.1080/2150704X.2015.1084551 Dietz, A.J., Wohner, C., Kuenzer, C., 2012. European Snow Cover Characteristics between 2000 and 2011 Derived from Improved MODIS Daily Snow Cover Products. Remote Sensing 4. https://doi.org/10.3390/rs4082432 Dietz, J.A., Conrad, C., Kuenzer, C., Gesell, G., Dech, S., 2014. Identifying Changing Snow Cover Characteristics in Central Asia between 1986 and 2014 from Remote Sensing Data. Remote Sensing 6. https://doi.org/10.3390/rs61212752 Rößler, S., Witt, M.S., Ikonen, J., Brown, I.A., Dietz, A.J., 2021. Remote Sensing of Snow Cover Variability and Its Influence on the Runoff of Sápmi’s Rivers. Geosciences 11, 130. https://doi.org/10.3390/geosciences11030130

  • The World Settlement Footprint (WSF) 3D provides detailed quantification of the average height, total volume, total area and the fraction of buildings at 90 m resolution at a global scale. It is generated using a modified version of the World Settlement Footprint human settlements mask derived from Sentinel-1 and Sentinel-2 satellite imagery in combination with digital elevation data and radar imagery collected by the TanDEM-X mission. The framework includes three basic workflows: i) the estimation of the mean building height based on an analysis of height differences along potential building edges, ii) the determination of building fraction and total building area within each 90 m cell, and iii) the combination of the height information and building area in order to determine the average height and total built-up volume at 90 m gridding. In addition, global height information on skyscrapers and high-rise buildings provided by the Emporis database is integrated into the processing framework, to improve the WSF 3D Building Height and subsequently the Building Volume Layer. A comprehensive validation campaign has been performed to assess the accuracy of the dataset quantitatively by using VHR 3D building models from 19 globally distributed regions (~86,000 km2) as reference data. The WSF 3D standard layers are provided in the format of Lempel-Ziv-Welch (LZW)-compressed GeoTiff files, with each file - or image tile - covering an area of 1 x 1 ° geographical lat/lon at a geometric resolution of 2.8 arcsec (~ 90 m at the equator). Following the system established by the TDX-DEM mission, the latitude resolution is decreased in multiple steps when moving towards the poles to compensate for the reduced circumference of the Earth.

Barrierefreiheit | Datenschutz | Impressum