 www.geodatenkatalog.de (S3L)
Keyword
AVHRR
5 record(s)
Provided by
Type of resources
Available actions
Topics
Keywords
Contact for the resource
Update frequencies
-

Every day, three successive NOAA-AVHRR scenes are used to derive a synthesis product in stereographic projection known as the "Normalized Difference Vegetation Index" for Europe and North Africa. It is calculated by dividing the difference in technical albedos between measurements in the near infrared and visible red part of the spectrum by the sum of both measurements. This value provides important information about the "greenness" and density of vegetation. Weekly and monthly thematic synthesis products are also derived from this daily operational product, at each step becoming successively free of clouds. For additional information, please see: https://wdc.dlr.de/sensors/avhrr/
-

The "Land Surface Temperature derived from NOAA-AVHRR data (LST_AVHRR)" is a fixed grid map (in stereographic projection) with a spatial resolution of 1.1 km. The total size covering Europe is 4100 samples by 4300 lines. Within 24 hours of acquiring data from the satellite, day-time and night-time LSTs are calculated. In general, the products utilise data from all six of the passes that the satellite makes over Europe in each 24 hour period. For the daily day-time LST maps, the compositing criterion for the three day-time passes is maximum NDVI value and for daily night-time LST maps, the criterion is the maximum night-time LST value of the three night-time passes. Weekly and monthly day-time or night-time LST composite products are also produced by averaging daily day-time or daily night-time LST values, respectively. The range of LST values is scaled between –39.5°C and +87°C with a radiometric resolution of 0.5°C. A value of –40°C is used for water. Clouds are masked out as bad values. For additional information, please see: https://wdc.dlr.de/sensors/avhrr/
-

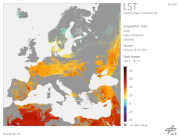
This dataset provides monthly maximum Land Surface Temperature (LST) values over Europe, derived from 1-km AVHRR observations. The data is generated by DLR and provided in the framework of the TIMELINE project. LST values are retrieved using physically-based split- and mono-window algorithms and corrected for atmospheric influences and surface emissivity. Only cloud-free observations with sensor view angles below 50 degrees are used. Due to reliance on infrared observations, data may be limited under persistent cloud cover. To ensure temporal consistency across sensors and overpass times, an orbit drift correction method was applied. This method harmonizes LST values to a fixed reference time of 13:00 local solar time, approximating the daily maximum temperature. The dataset is gridded in a 1-km LAEA ETRS89 projection. The product is provided in four tiles, covering the extent of the European Environmental Agency (EEA) reference grid, which includes the area from 900 000 m East and 900 000m North to 7 400 000m East and 5 500 000m North. The TIMELINE (TIMe Series Processing of Medium Resolution Earth Observation Data assessing Long-Term Dynamics In our Natural Environment) project, led by the German Remote Sensing Data Center (DFD) of the German Aerospace Center (DLR), focuses on generating a consistent, multi-decadal time series derived from NOAA and Metop AVHRR data. Spanning more than 40 years from the early 1980s to the present this dataset covers Europe and North Africa. TIMELINE establishes an operational environment for the systematic reprocessing of AVHRR raw data into Level 1b, Level 2, and Level 3 geoinformation products at 1.1 km spatial resolution. These products maintain uniform standards in format, projection, and spatial coverage. The dataset includes a comprehensive suite of land and atmospheric parameters such as atmospherically corrected surface reflectance, NDVI, snow cover, fire hotspots, burnt area, land and sea surface temperatures, and various cloud physical properties (e.g., cloud top temperature). By combining traditional and innovative remote sensing products with robust processing algorithms and state-of-the-art validation techniques, TIMELINE provides a unique, high-quality dataset for global change research.
-
The "Land Surface Temperature derived from NOAA-AVHRR data (LST_AVHRR)" is a fixed grid map (in stereographic projection ) with a spatial resolution of 1.1 km. The total size covering Europe is 4100 samples by 4300 lines. Within 24 hours of acquiring data from the satellite, day-time and night-time LSTs are calculated. In general, the products utilise data from all six of the passes that the satellite makes over Europe in each 24 hour period. For the daily day-time LST maps, the compositing criterion for the three day-time passes is maximum NDVI value and for daily night-time LST maps, the criterion is the maximum night-time LST value of the three night-time passes. Weekly and monthly day-time or night-time LST composite products are also produced by averaging daily day-time or daily night-time LST values, respectively. The range of LST values is scaled between –39.5°C and +87°C with a radiometric resolution of 0.5°C. A value of –40°C is used for water. Clouds are masked out as bad values. For additional information, please see: https://wdc.dlr.de/sensors/avhrr/
-

The AVHRR Mulitchannel Sea Surface Temperature Map (MCSST) was the first result of DLR's AVHRR pathfinder activities. The goal of the product is to provide the user with actual Sea Surface Temperature (SST) maps in a defined format easy to access with the highest possible reliability on the thematic quality. After a phase of definition, the operational production chain was launched in March 1993 covering the entire Mediterranean Sea and the Black Sea. Since then, daily, weekly, and monthly data sets have been available until September 13, 1994, when the AVHRR on board the NOAA-11 spacecraft failed. The production of daily, weekly and monthly SST maps was resumed in February, 1995, based on NOAA-14 AVHRR data. The NOAA-14 AVHRR sensor became some technical difficulties, so the generation was stopped on October 3, 2001. Since March 2002, NOAA-16 AVHRR SST maps are available again. With the beginning of January 2004, the data of AVHRR on board of NOAA-16 exhibited some anormal features showing strips in the scenes. Facing the “bar coded” images of NOAA16-AVHRR which occurred first in September 2003, continued in January 2004 for the second time and appeared in April 2004 again, DFD has decided to stop the reception of NOAA16 data on April 6th, 2004, and to start the reception of NOAA-17 data on this day. On April 7th, 2004, the production of all former NOAA16-AVHRR products as e.g. the SST composites was successully established. NOAA-17 is an AM sensor which passes central Europe about 2 hours earlier than NOAA-16 (about 10:00 UTC instead of 12:00 UTC for NOAA-16). In spring 2007, the communication system of NOAA-17 has degraded or is operating with limitations. Therefore, DFD has decided to shift the production of higher level products (NDVI, LST and SST) from NOAA-17 to NOAA-18 in April 2007. In order to test the performance of our processing chains, we processed simultaneously all NOAA-17 and NOAA-18 data from January 1st, 2007 till March 29th, 2007. All products are be available via EOWEB. Please remember that NOAA-18 is a PM sensor which passes central Europe about 1.5 hours later than NOAA-17 (about 11:30 UTC instead of 10:00 UTC for NOAA17). The SST product is intended for climate modelers, oceanographers, and all geo science-related disciplines dealing with ocean surface parameters. In addition, SST maps covering the North Atlantic, the Baltic Sea, the North Sea and the Western Atlantic equivalent to the Mediterranean MCSST maps are available since August 1994. The most important aspects of the MCSST maps are a) correct image registration and b) reasonable cloud screening to ensure that only cloud free pixels are taken for the later processing and compositing c) for deriving MCSST, only channel 4 and 5 are used.. The SST product consists of one 8 bit channel. For additional information, please see: https://wdc.dlr.de/sensors/avhrr/