 My GeoNetwork catalogue
air temperature
Provided by
Type of resources
Available actions
Topics
Keywords
Contact for the resource
Update frequencies
-

The regional averages are derived from the grids of the annual mean of grids of monthly mean of the dail mean air temperature for Germany.
-
Spatial Distribution of Near-surface Air Temperature in the Glacierized Areas of the Tibetan Plateau
This dataset contains spatial distribution of near-surface air temperature in the glacierized areas of the Tibetan Plateau, which has been processed using meteorological observation data, thermal infrared remote sensing data and glacier boundaries from China's Second Glacier Inventory. The data covers a high-altitude area of the Qinghai-Tibet Plateau for seven glacier regions (Guliya, Aru, Naimona'nyi, Gagze, Dunde, Parlung, and XiaodongKemadi), with a spatial resolution of 30 meters, spanning elevations of 3,924-6,078 m and temperatures of -42°C to +21°C. The original temperature data were obtained from multiple sources, including thermal infrared remote sensing data from Landsat 8 (L8) and Landsat 9 (L9) Collection 2 (C2) Level 2 (L2) products, as well as ground station measurements from National Tibetan Plateau/Third Pole Environment Data Center. Missing values were reconstructed through masked nearest-neighbor interpolation, followed by spatial smoothing to minimize residual inaccuracies during the temperature field updating process. This approach (gap-filling, bias-correction, smoothing) ensured robust spatialization of near-surface air temperature data. Technical validations are detailed in Accuracy and Completeness Reports. The dataset provides temperature distributions for glacier-covered areas of the Qinghai-Tibet Plateau. This dataset is suitable for climate research, environmental monitoring, and cryosphere. The experiment's temporal coverage is discontinuous; the eight datasets have different time ranges. The temporal coverage includes Southeastern data (2023-01 to 2023-03), Xiaodongkemadi data (2012-05 to 2015-08), and Aru, Dagze, Dunde, Guliya, Naimona'nyi, and Parlung data (all from 2019-01, with end dates ranging from 2019-10 to 2019-11). Southeastern data: 2023-01 to 2023-03 Xiaodongkemadi data: 2012-05 to 2015-08 Aru data: 2019-01 to 2019-10 Dagze data: 2019-01 to 2019-10 Dunde data: 2019-01 to 2019-11 Guliya data: 2019-01 to 2019-10 Naimona'nyi data: 2019-01 to 2019-10 Parlung data: 2019-01 to 2019-10
-

-
This experiment contains 30-meter resolution near-surface air temperature datasets for four glacier regions (Guliya, Aru, Naimona’nyi, Dunde) on the Qinghai-Tibet Plateau, derived by integrating in situ measurements (automatic weather stations and loggers; January-November 2019) with Landsat 8/9 thermal infrared data. The datasets, spanning elevations of 4,947–6,078 m and temperatures from −42°C to +16°C, address data gaps through masked nearest-neighbor interpolation and Kriging (for clustered outliers ≥5), with spatial smoothing to minimize observational noise. Validation against ground measurements employs Root Mean Square Error (RMSE) of °C and standard deviation (SD) of °C metrics, visualized via Temperature_Error graphs. The glaciers-representing diverse climatic zones-include Guliya (ice cap, westerlies-dominated), Aru (valley glacier), Naimona’nyi (Himalayan slopes), and Dunde (Qilian Mountains, transitional climate). Supported by elevation data from the Topographic Data of Qinghai-Tibet Plateau (2021) and temperature data from the GATP Dataset (doi:10.26050/WDCC/GATP). These spatially interpolated temperature distributions serve as a reference for assessing cryospheric and climate models in high-altitude regions.
-
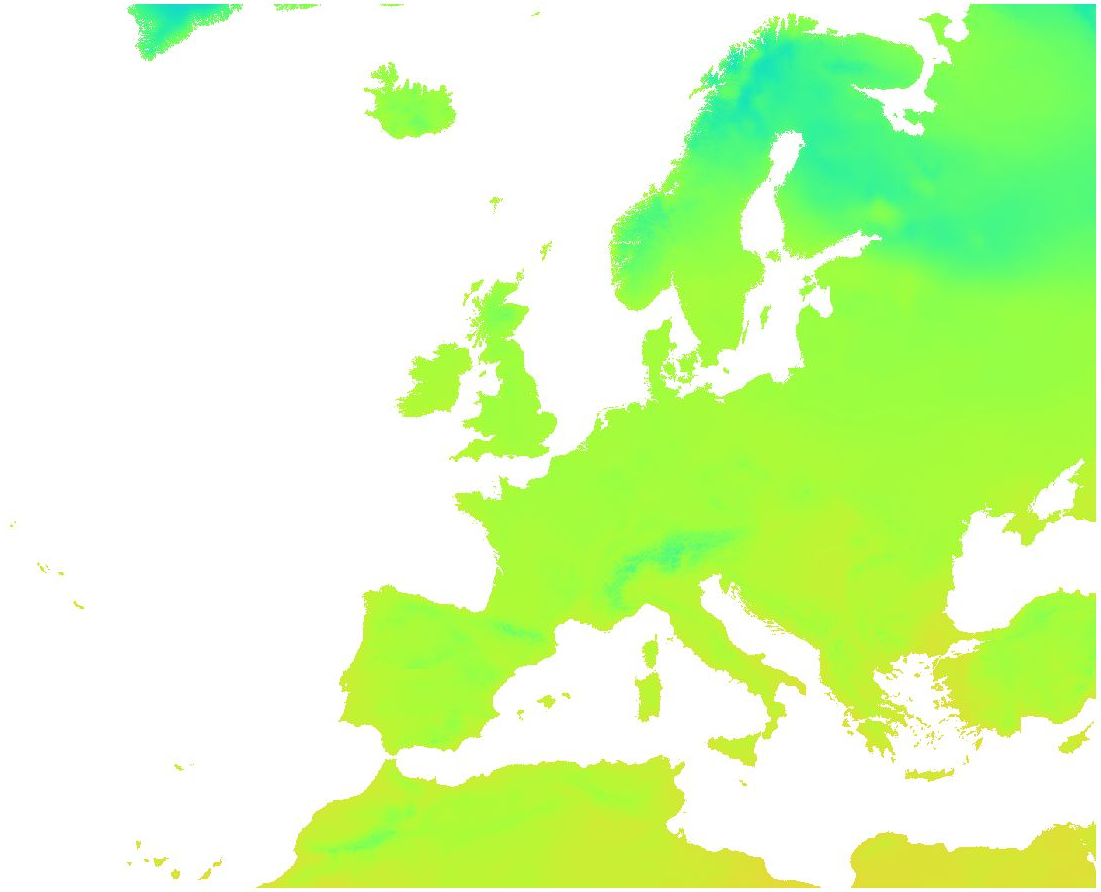
Overview: ERA5-Land is a reanalysis dataset providing a consistent view of the evolution of land variables over several decades at an enhanced resolution compared to ERA5. ERA5-Land has been produced by replaying the land component of the ECMWF ERA5 climate reanalysis. Reanalysis combines model data with observations from across the world into a globally complete and consistent dataset using the laws of physics. Reanalysis produces data that goes several decades back in time, providing an accurate description of the climate of the past. Air temperature (2 m): Temperature of air at 2m above the surface of land, sea or in-land waters. 2m temperature is calculated by interpolating between the lowest model level and the Earth's surface, taking account of the atmospheric conditions. The original ERA5-Land dataset (period: 2000 - 2020) has been reprocessed to: - aggregate ERA5-Land hourly data to daily data (minimum, mean, maximum) - while increasing the spatial resolution from the native ERA5-Land resolution of 0.1 degree (~ 9 km) to 30 arc seconds (~ 1 km) by image fusion with CHELSA data (V1.2) (https://chelsa-climate.org/). For each day we used the corresponding monthly long-term average of CHELSA. The aim was to use the fine spatial detail of CHELSA and at the same time preserve the general regional pattern and fine temporal detail of ERA5-Land. The steps included aggregation and enhancement, specifically: 1. spatially aggregate CHELSA to the resolution of ERA5-Land 2. calculate difference of ERA5-Land - aggregated CHELSA 3. interpolate differences with a Gaussian filter to 30 arc seconds 4. add the interpolated differences to CHELSA Data available is the daily average, minimum and maximum of air temperature (2 m). Spatial resolution: 30 arc seconds (approx. 1000 m) Temporal resolution: Daily Pixel values: °C * 10 (scaled to Integer; example: value 238 = 23.8 %) Software used: GDAL 3.2.2 and GRASS GIS 8.0.0 (r.resamp.stats -w; r.relief) Original ERA5-Land dataset license: https://cds.climate.copernicus.eu/api/v2/terms/static/licence-to-use-copernicus-products.pdf CHELSA climatologies (V1.2): Data used: Karger D.N., Conrad, O., Böhner, J., Kawohl, T., Kreft, H., Soria-Auza, R.W., Zimmermann, N.E, Linder, H.P., Kessler, M. (2018): Data from: Climatologies at high resolution for the earth's land surface areas. Dryad digital repository. http://dx.doi.org/doi:10.5061/dryad.kd1d4 Original peer-reviewed publication: Karger, D.N., Conrad, O., Böhner, J., Kawohl, T., Kreft, H., Soria-Auza, R.W., Zimmermann, N.E., Linder, P., Kessler, M. (2017): Climatologies at high resolution for the Earth land surface areas. Scientific Data. 4 170122. https://doi.org/10.1038/sdata.2017.122
-
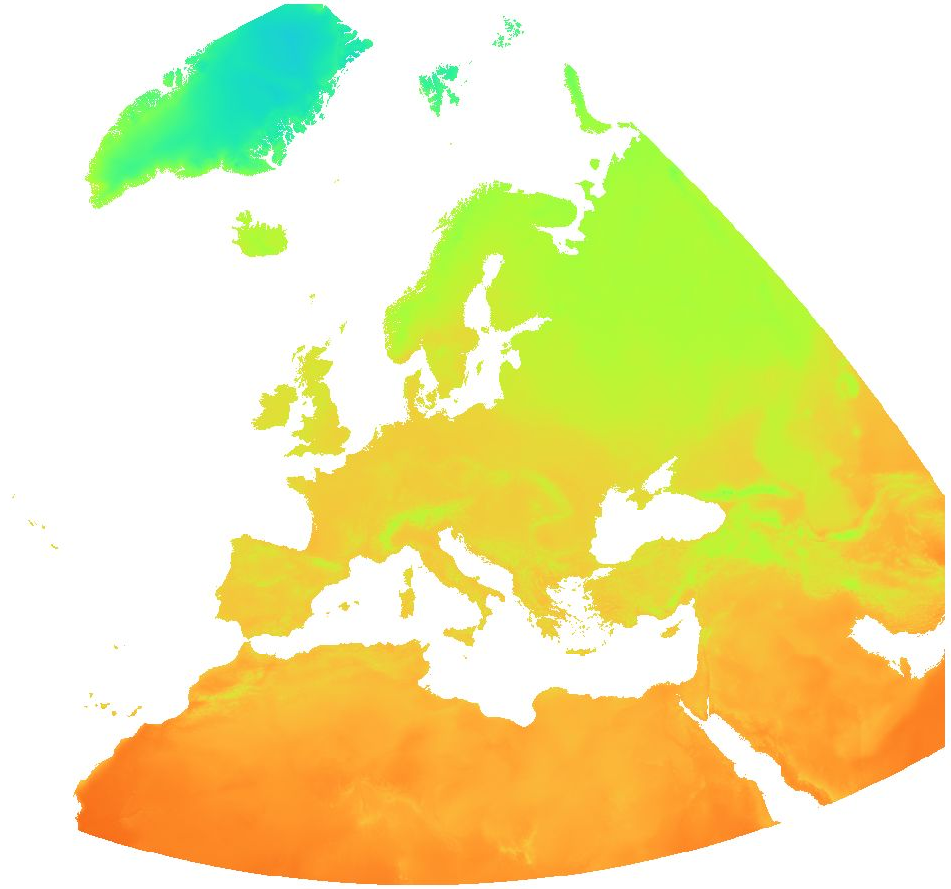
Overview: ERA5-Land is a reanalysis dataset providing a consistent view of the evolution of land variables over several decades at an enhanced resolution compared to ERA5. ERA5-Land has been produced by replaying the land component of the ECMWF ERA5 climate reanalysis. Reanalysis combines model data with observations from across the world into a globally complete and consistent dataset using the laws of physics. Reanalysis produces data that goes several decades back in time, providing an accurate description of the climate of the past. Air temperature (2 m): Temperature of air at 2m above the surface of land, sea or in-land waters. 2m temperature is calculated by interpolating between the lowest model level and the Earth's surface, taking account of the atmospheric conditions. Processing steps: The original hourly ERA5-Land data has been spatially enhanced from 0.1 degree to 30 arc seconds (approx. 1000 m) spatial resolution by image fusion with CHELSA data (V1.2) (https://chelsa-climate.org/). For each day we used the corresponding monthly long-term average of CHELSA. The aim was to use the fine spatial detail of CHELSA and at the same time preserve the general regional pattern and fine temporal detail of ERA5-Land. The steps included aggregation and enhancement, specifically: 1. spatially aggregate CHELSA to the resolution of ERA5-Land 2. calculate difference of ERA5-Land - aggregated CHELSA 3. interpolate differences with a Gaussian filter to 30 arc seconds 4. add the interpolated differences to CHELSA The spatially enhanced daily ERA5-Land data has been aggregated on a weekly basis starting from Saturday for the time period 2016 - 2020. Data available is the weekly average of daily averages, the weekly minimum of daily minima and the weekly maximum of daily maxima of air temperature (2 m). File naming: Average of daily average: era5_land_t2m_avg_weekly_YYYY_MM_DD.tif Max of daily max: era5_land_t2m_max_weekly_YYYY_MM_DD.tif Min of daily min: era5_land_t2m_min_weekly_YYYY_MM_DD.tif The date in the file name determines the start day of the week (Saturday). Pixel value: °C * 10 Example: Value 44 = 4.4 °C The QML or SLD style files can be used for visualization of the temperature layers. Coordinate reference system: ETRS89 / LAEA Europe (EPSG:3035) (EPSG:3035) Spatial extent: north: 82:00:30N south: 18N west: 32:00:30W east: 70E Spatial resolution: 1km Temporal resolution: weekly Time period: 01/01/2016 - 12/31/2020 Format: GeoTIFF Representation type: Grid Software used: GDAL 3.2.2 and GRASS GIS 8.0.0 (r.resamp.stats -w; r.relief) Lineage: Dataset has been processed from original Copernicus Climate Data Store (ERA5-Land) data sources. As auxiliary data CHELSA climate data has been used. Original ERA5-Land dataset license: https://cds.climate.copernicus.eu/api/v2/terms/static/licence-to-use-copernicus-products.pdf CHELSA climatologies (V1.2): Data used: Karger D.N., Conrad, O., Böhner, J., Kawohl, T., Kreft, H., Soria-Auza, R.W., Zimmermann, N.E, Linder, H.P., Kessler, M. (2018): Data from: Climatologies at high resolution for the earth's land surface areas. Dryad digital repository. http://dx.doi.org/doi:10.5061/dryad.kd1d4 Original peer-reviewed publication: Karger, D.N., Conrad, O., Böhner, J., Kawohl, T., Kreft, H., Soria-Auza, R.W., Zimmermann, N.E., Linder, P., Kessler, M. (2017): Climatologies at high resolution for the Earth land surface areas. Scientific Data. 4 170122. https://doi.org/10.1038/sdata.2017.122 Other resources: https://data.mundialis.de/geonetwork/srv/eng/catalog.search#/metadata/601ea08c-0768-4af3-a8fa-7da25fb9125b Processed by: mundialis GmbH & Co. KG, Germany (https://www.mundialis.de/) Contact: mundialis GmbH & Co. KG, info@mundialis.de Acknowledgements: This study was partially funded by EU grant 874850 MOOD. The contents of this publication are the sole responsibility of the authors and don't necessarily reflect the views of the European Commission.
-
postprocessed (downscaled an bias corrected) daily means of 2-meter-air-temperature, global radiation and daily amount of precipitation; based on regional climate projections; focussed on the period 1951-2100; gridded with 5 km horizontal spatial resolution; refers to Germany and hydrological catchment areas of Danube, Rhine, Elbe and Odra; was founded by KLIWAS (Impacts of climate change on Waterways and Navigation); provided by Department Climate and Environment Consultancy of Deutscher Wetterdienst
-

Marine Forecast is an internet application that provides current data and information from the meteorological and oceanographic field. The data are current measurement and forecast data on different topics, which can be combined in different ways.
-

The “Marine Information” application provides various marine and meteorological information for water level locations on the Weser, Elbe,Ems, North Sea, and Baltic Sea. For each water level location, users can view information about the water level, water surface temperature, air temperature, wind speed and direction, and the times of sunrise and sunset and moonrise and moonset. The data is updated at least once a day, depending on availability and type.
-

The ”Water Recreation” app provides interested users with information on water levels, water and air temperatures, and wind strength and direction, enabling them to plan their activities on and in the water.