Keyword
Harbour porpoise
4 record(s)
Provided by
Type of resources
Available actions
Topics
Keywords
Contact for the resource
Update frequencies
Service types
-

This service contains information on the population density of harbor porpoises in German Exclusive Economic Zone (EEZ) based on a 10x10 km grid (EU-GRID). Density [individuals/km²] is calculated for each 10x10 km grid cell by adding the number of individuals within the respective grid cell and dividing by the sum of the effort (area surveyed and period the area was sampled). Individual layers subdivided by season (March-May: spring; June-August: summer; September-November: fall; December-February: winter) show the distribution of harbor porpoises in the respective year. Direct comparability with the data in the BfN service "Porpoise monitoring distribution in individual years" is limited, since the current BSH service only used data collected using the digital flight observation technique.
-

This service contains information on the population density of harbor porpoises in German Exclusive Economic Zone (EEZ) based on a 10x10 km grid (EU-GRID). Density [individuals/km²] is calculated for each 10x10 km grid cell by adding the number of individuals within the respective grid cell and dividing by the sum of the effort (area surveyed and period the area was sampled). Individual layers subdivided by season (March-May: spring; June-August: summer; September-November: fall; December-February: winter) show the distribution of harbor porpoises in the respective year. Direct comparability with the data in the BfN service "Porpoise monitoring distribution in individual years" is limited, since the current BSH service only used data collected using the digital flight observation technique.
-

This service contains information on the population density of harbor porpoises in German Exclusive Economic Zone (EEZ) based on a 10x10 km grid (EU-GRID). Density [individuals/km²] is calculated for each 10x10 km grid cell by adding the number of individuals within the respective grid cell and dividing by the sum of the effort (area surveyed and period the area was sampled). Individual layers subdivided by season (March-May: spring; June-August: summer; September-November: fall; December-February: winter) show the distribution of harbor porpoises in the respective year. Direct comparability with the data in the BfN service "Porpoise monitoring distribution in individual years" is limited, since the current BSH service only used data collected using the digital flight observation technique.
-

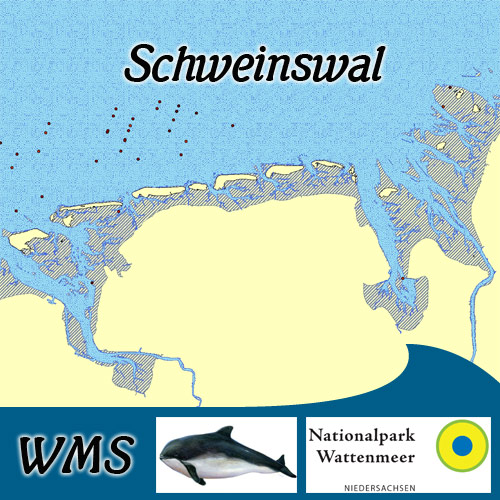
Erfassung des Schweinswalbestandes im Küstenmeer von Borkum bis Cuxhaven. Mit Hilfe der Linientransekt-Methode wurden Befliegungen 2008 & 2010 durchgeführt.
 www.geodatenkatalog.de (S1L)