 My GeoNetwork catalogue
World
Provided by
Type of resources
Topics
Keywords
Contact for the resource
Update frequencies
-
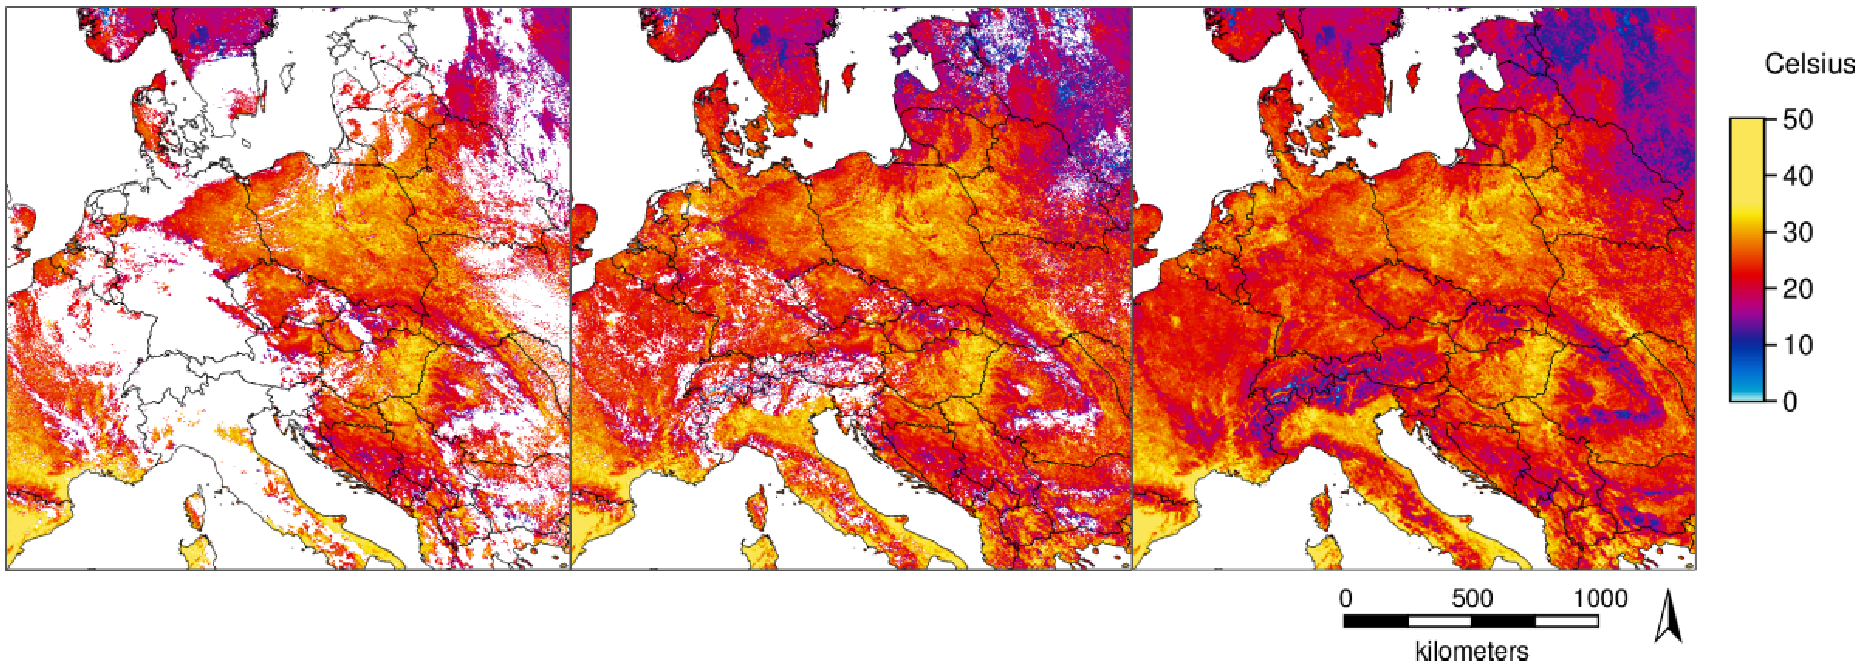
Temperature time series with high spatial and temporal resolutions are important for several applications. The new MODIS Land Surface Temperature (LST) collection 6 provides numerous improvements compared to collection 5. However, being remotely sensed data in the thermal range, LST shows gaps in cloud-covered areas. With a novel method [1] we fully reconstructed the daily global MODIS LST products MOD11A1/MYD11A1 (spatial resolution: 1 km). For this, we combined temporal and spatial interpolation, using emissivity and elevation as covariates for the spatial interpolation. The data are provided in GeoTIFF format. The Coordinate Reference System (CRS) is identical to the MOD11A1/MYD11A1 product (Sinusoidal) as provided by NASA. In WKT as reported by GDAL: PROJCRS["unnamed", BASEGEOGCRS["Unknown datum based upon the custom spheroid", DATUM["Not specified (based on custom spheroid)", ELLIPSOID["Custom spheroid",6371007.181,0, LENGTHUNIT["metre",1, ID["EPSG",9001]]]], PRIMEM["Greenwich",0, ANGLEUNIT["degree",0.0174532925199433, ID["EPSG",9122]]]], CONVERSION["unnamed", METHOD["Sinusoidal"], PARAMETER["Longitude of natural origin",0, ANGLEUNIT["degree",0.0174532925199433], ID["EPSG",8802]], PARAMETER["False easting",0, LENGTHUNIT["Meter",1], ID["EPSG",8806]], PARAMETER["False northing",0, LENGTHUNIT["Meter",1], ID["EPSG",8807]]], CS[Cartesian,2], AXIS["easting",east, ORDER[1], LENGTHUNIT["Meter",1]], AXIS["northing",north, ORDER[2], LENGTHUNIT["Meter",1]]] Acknowledgments: We are grateful to the NASA Land Processes Distributed Active Archive Center (LP DAAC) for making the MODIS LST data available. The dataset is based on MODIS Collection V006. Meaning of pixel values: The pixel values are coded in Kelvin * 50 Data type: raster, UInt16 Spatial resolution: 926.62543314 m Spatial extent Sinusoidal (W, S, E, N): 0, 4447802.079066, 2223901.039533, 6671703.118599 Spatial extent in EPSG:4326 (W, S, E, N): 0, 40, 40, 60 [1] Metz M., Andreo V., Neteler M. (2017): A new fully gap-free time series of Land Surface Temperature from MODIS LST data. Remote Sensing, 9(12):1333. DOI: http://dx.doi.org/10.3390/rs9121333
-

The GEMStat Dashboard visualizes the water quality of global water bodies on different spatial and temporal scales, based on data from the GEMStat Database . Available data includes the parameters dissolved oxygen, nitrogen, phosphorus and pH, all core parameters of the UN SDG 6.3.2 water quality indicator. The data are voluntarily provided by countries and organizations worldwide within the framework of the GEMS/Water Programme of the United Nations Environment Programme (UNEP) .
-

The GEMStat Data Portal provides access to freshwater quality data and statistical vizualisations at different spatial scales. The data are voluntarily provided by countries and organizations worldwide within the framework of the GEMS/Water Programme of the United Nations Environment Programme (UNEP) .
-

The Global Runoff Data Centre is an International data centre operating under the auspices of the World Meteorological Organization (WMO). Its primary objective consists in supporting the water and climate related programmes and projects of the United Nations, its specialised agencies and the scientific research community by collecting and disseminating hydrological data across national borders in a long-term perspective.
-
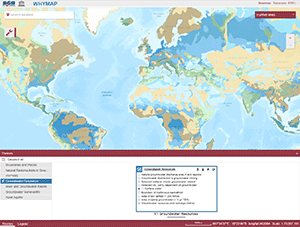
The World-wide Hydrogeological Mapping and Assessment Programme (WHYMAP) provides data and information about the earth´s major groundwater resources. The WHYMAP Viewer provides access to the topics “Groundwater Resources of the World", "World-wide River and Groundwater Basins", "World-wide Groundwater Vulnerability", "Karst Aquifers of the World", and to the “World-wide Hydrogeological Map Information System (WHYMIS)”.
-
Time series of daily and/or monthly river discharge data of more than 9200 stations from 160 countries, comprising around 390,000 station-years with an average time series length of about 42 years. The earliest daily data are from the year 1806, the most recent from the year 2016.
-

The Annual Characteristics and Long-Term Statistics offer basic hydrological statistics of timeseries data of the gauging stations being represented in the Global Runoff Database. Annual characteristics are derived from monthly discharge data, either through aggregated daily data or originally provided monthly data. Long-term statistics and long-term variability are derived from annual characteristics too.
-
The UZDL99 TTAAii Data Designators decode as: T1 (U): Upper air data T1T2 (UZ): Upper level pressure, temperature, humidity and wind from a sonde released by carrier balloon or aircraft (Parts A, B, C, D) A1A2 (DL): Germany (Remarks from Volume-C: CAMPAGNE DATA FROM BARBADOS ESTIMATED JAN 20 - FEB 17, 2020)
-
The UZAC99 TTAAii Data Designators decode as: T1 (U): Upper air data T1T2 (UZ): Upper level pressure, temperature, humidity and wind from a sonde released by carrier balloon or aircraft (Parts A, B, C, D) A1A2 (AC): Arctic(Remarks from Volume-C: CAMPAGNE DATA FROM ARCTIC FLYOVER ESTIMATED AUG 05 - SEP 15, 2022)
-
The UZXT99 TTAAii Data Designators decode as: T1 (U): Upper air data T1T2 (UZ): Upper level pressure, temperature, humidity and wind from a sonde released by carrier balloon or aircraft (Parts A, B, C, D) A1A2 (XT): Tropical Belt(Remarks from Volume-C: CAMPAGNE DATA FROM Tropical Belt, Capo Verde - Barbados FLYOVER ESTIMATED AUG 08 - NOV 24, 2024)