 My GeoNetwork catalogue
DEM
Provided by
Type of resources
Available actions
Topics
Keywords
Contact for the resource
Update frequencies
Service types
-

The global TanDEM-X High-Resolution Coastline Product was developed by the German Remote Sensing Data Center (DFD) at the German Aerospace Center (DLR) as part of the TanDEM-X Mission and the HydroSHEDS v2.0 project. It is a global vector dataset that outlines the boundary between terrestrial and marine environments at a resolution of 10 meters. Between 2010 and 2015, the TanDEM-X mission acquired a complete coverage of the Earth's landmass, resulting in a global digital elevation model (DEM). Since the TanDEM-X coastline is derived from the TanDEM-X dataset, it provides an optimal fit for improving the DEM. Additionally, the TanDEM-X coastline is a key component in the derivation of hydrographic data within the HydroSHEDS v2.0 project, where it defines the outer boundary of watersheds and river networks. To meet hydrological requirements and to ensure global consistency, the TanDEM-X coastline was extracted automatically in a first step and subsequently manually verified and refined. Since the coastline is a mapping feature located in the coastal zone, its position is a function of the source data, the method used to identify the coastline, the time of acquisition, and the purpose of mapping.
-
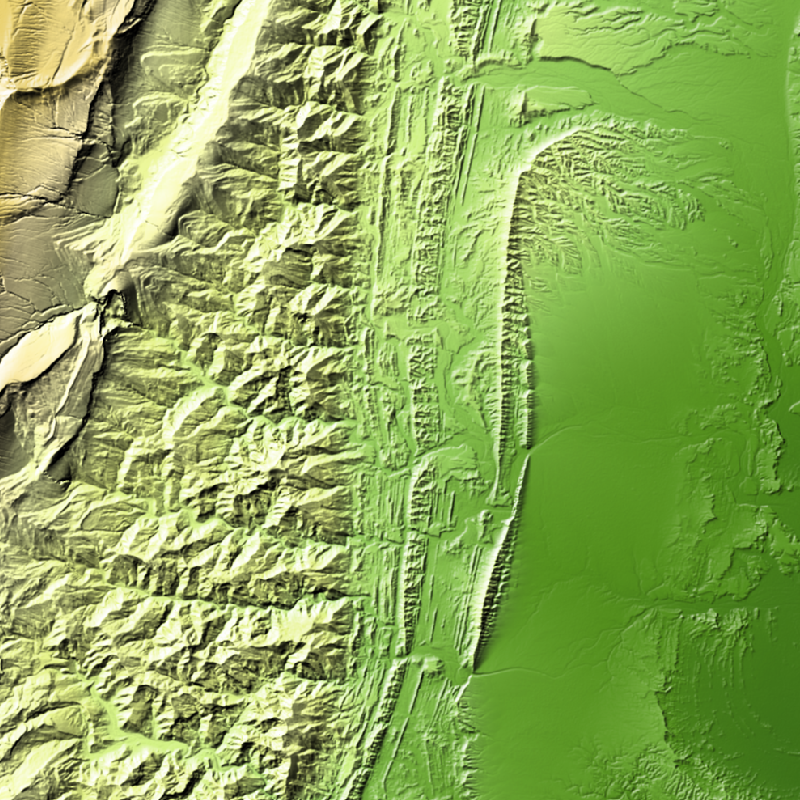
TanDEM-X (TerraSAR-X add-on for Digital Elevation Measurements) is an Earth observation radar mission that consists of a SAR interferometer built by two almost identical satellites flying in close formation. With a typical separation between the satellites of 120 m to 500 m a global Digital Elevation Model (DEM) has been generated. The TanDEM-X 30m EDEM is a product variant of the global Digital Elevation Model (DEM) acquired in the frame of the German TanDEM-X mission between 2010 and 2014, and has a reduced pixel spacing of 1 arcseconds (arsec), which corresponds to 30m at the equator. An automated edition was developed by the Microwaves and Radar Institute at the German Aerospace Center (DLR) to have a full and clean coverage of all Earth’s landmasses from pole to pole.
-
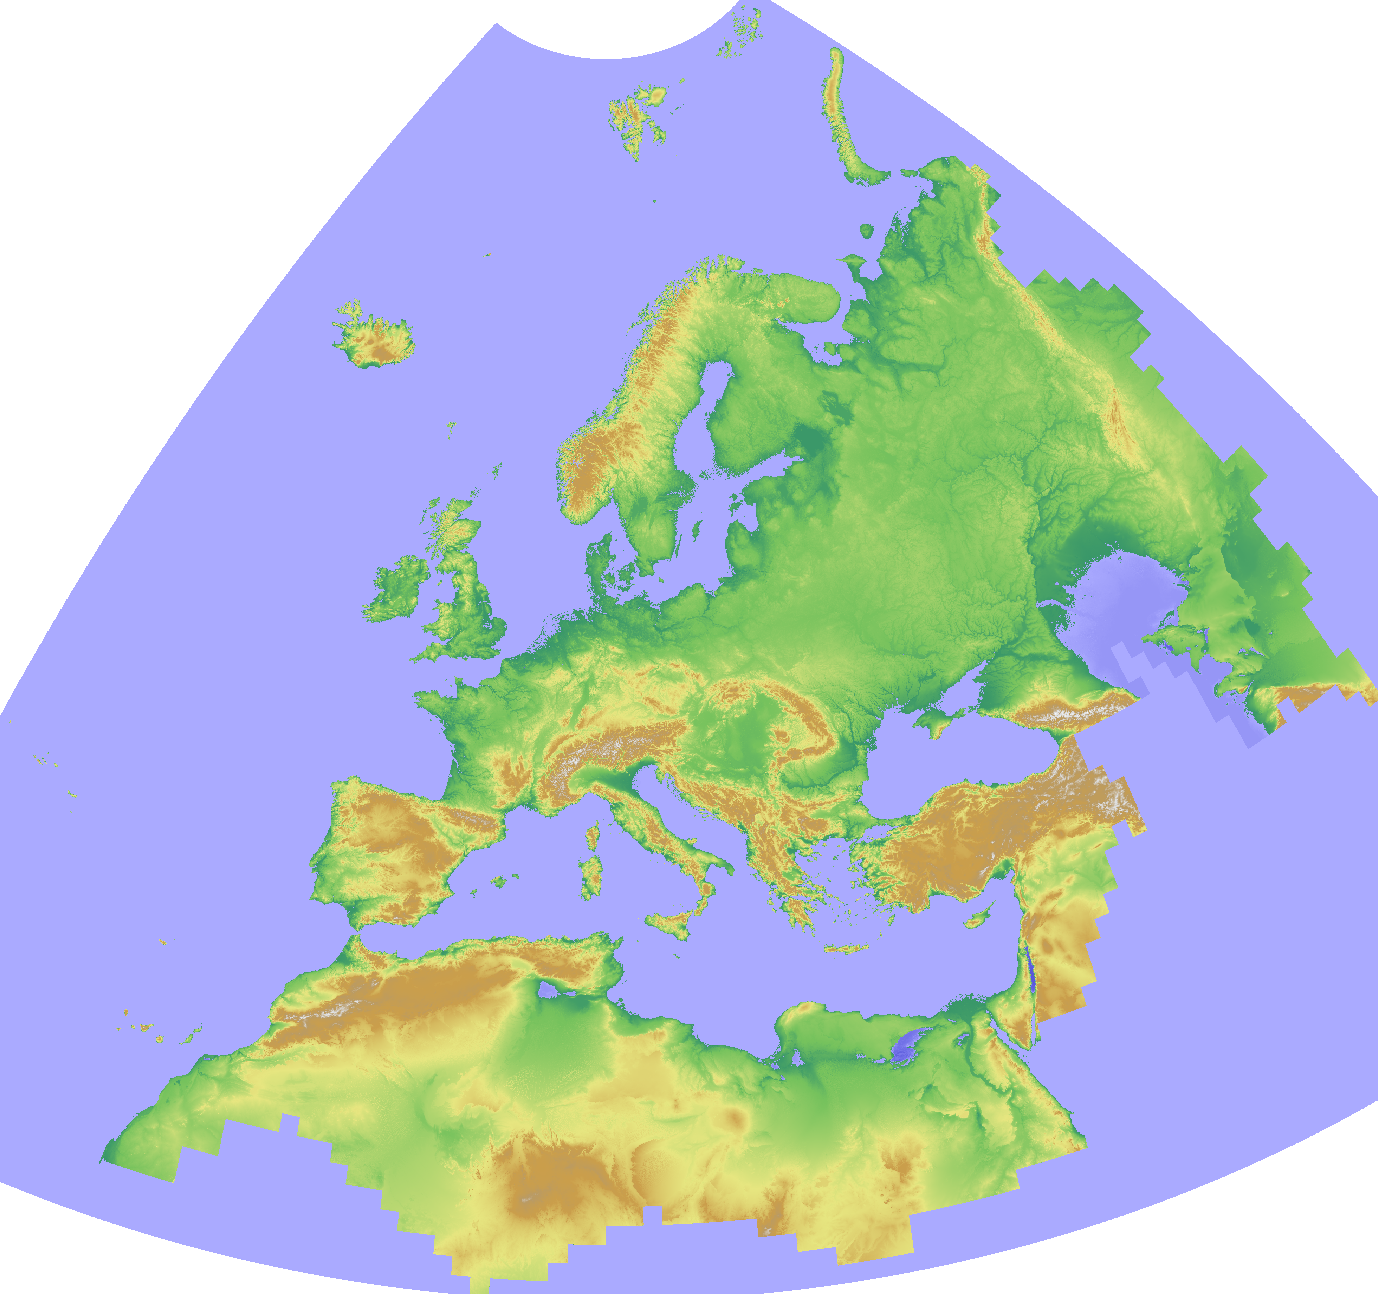
The Copernicus DEM is a Digital Surface Model (DSM) which represents the surface of the Earth including buildings, infrastructure and vegetation. The original GLO-30 provides worldwide coverage at 30 meters (refers to 10 arc seconds). Note that ocean areas do not have tiles, there one can assume height values equal to zero. Data is provided as Cloud Optimized GeoTIFFs. Note that the vertical unit for measurement of elevation height is meters. The Copernicus DEM for Europe at 30 meter resolution (EU-LAEA projection) in COG format has been derived from the Copernicus DEM GLO-30, mirrored on Open Data on AWS, dataset managed by Sinergise (https://registry.opendata.aws/copernicus-dem/). Processing steps: The original Copernicus GLO-30 DEM contains a relevant percentage of tiles with non-square pixels. We created a mosaic map in https://gdal.org/drivers/raster/vrt.html format and defined within the VRT file the rule to apply cubic resampling while reading the data, i.e. importing them into GRASS GIS for further processing. We chose cubic instead of bilinear resampling since the height-width ratio of non-square pixels is up to 1:5. Hence, artefacts between adjacent tiles in rugged terrain could be minimized: gdalbuildvrt -input_file_list list_geotiffs_MOOD.csv -r cubic -tr 0.000277777777777778 0.000277777777777778 Copernicus_DSM_30m_MOOD.vrt In order to reproject the data to EU-LAEA projection, bilinear resampling was performed in GRASS GIS (using r.proj) and the pixel values were scaled with 1000 (storing the pixels as Integer values) for data volume reduction. In addition, a hillshade raster map was derived from the resampled elevation map (using r.relief, GRASS GIS). Eventually, we exported the elevation and hillshade raster maps in Cloud Optimized GeoTIFF (COG) format, along with SLD and QML style files. Note that GLO-30 Public provides limited coverage at 30 meters because a small subset of tiles covering specific countries are not yet released to the public by the Copernicus Programme. Note that ocean areas do not have tiles, there one can assume height values equal to zero. Data is provided as Cloud Optimized GeoTIFFs.
-
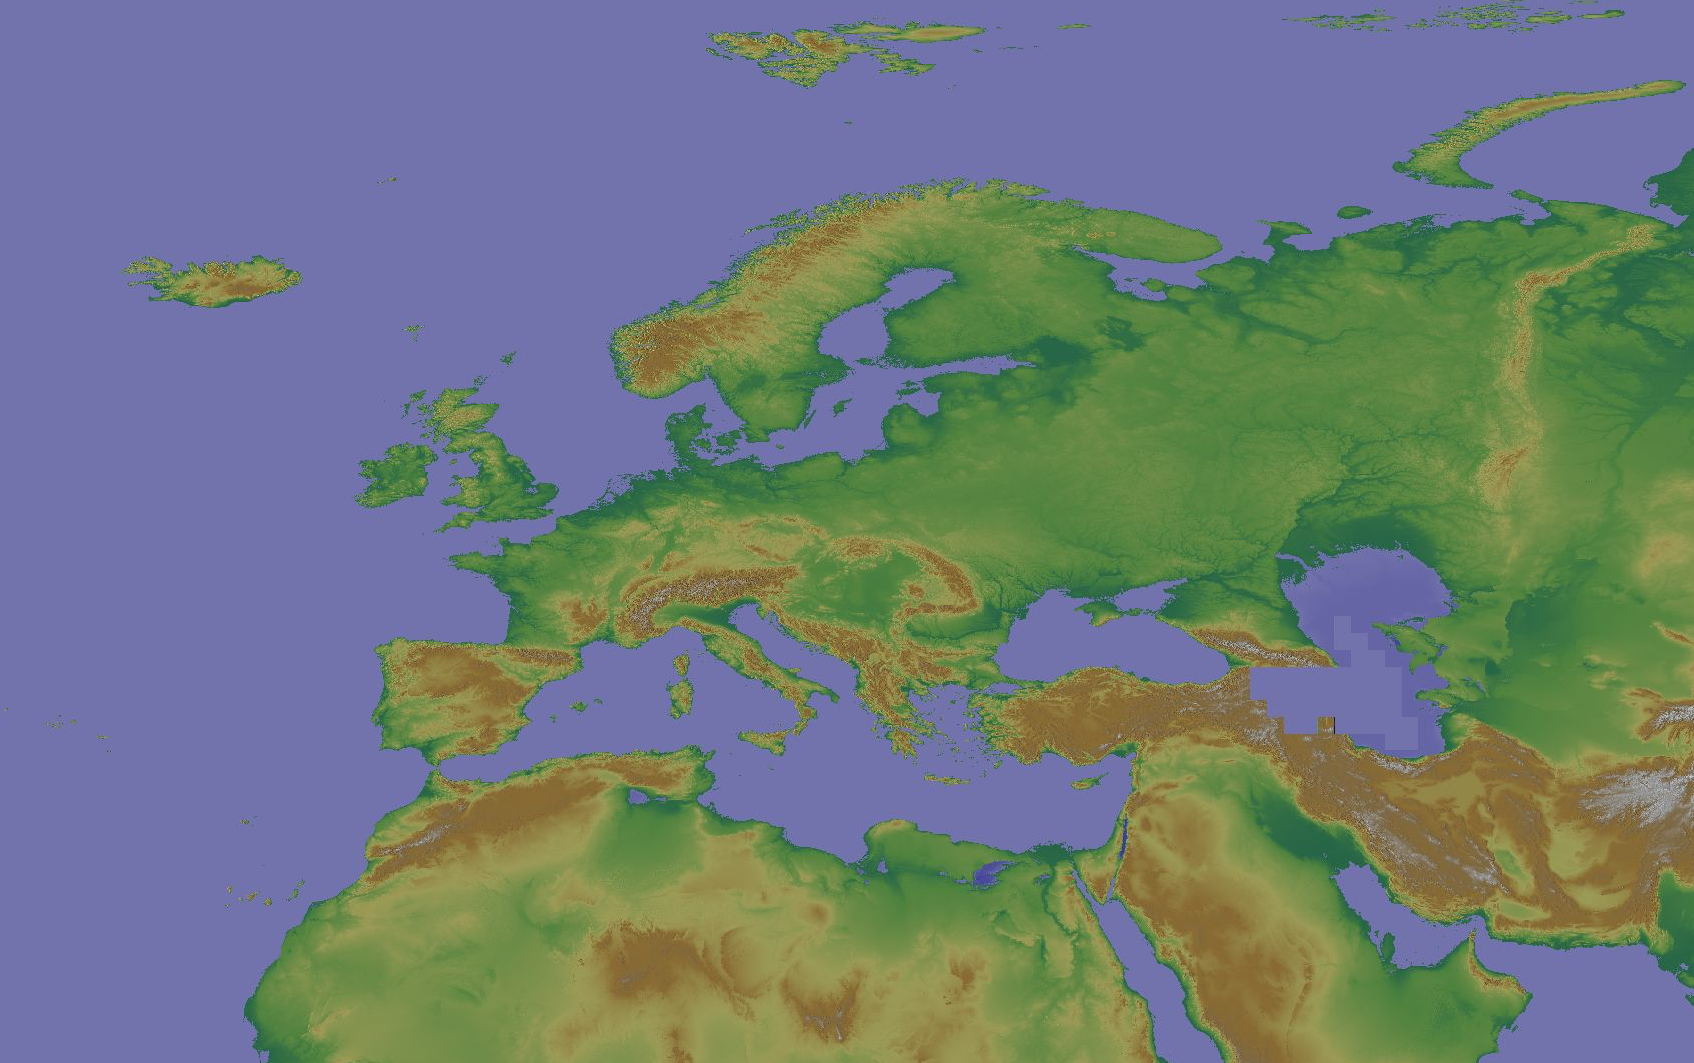
The Copernicus DEM is a Digital Surface Model (DSM) which represents the surface of the Earth including buildings, infrastructure and vegetation. The original GLO-30 provides worldwide coverage at 30 meters (refers to 10 arc seconds). Note that ocean areas do not have tiles, there one can assume height values equal to zero. Data is provided as Cloud Optimized GeoTIFFs. Note that the vertical unit for measurement of elevation height is meters. The Copernicus DEM for Europe at 30 arcsec (0:00:30 = 0.0083333333 ~ 1000 meter) in COG format has been derived from the Copernicus DEM GLO-30, mirrored on Open Data on AWS, dataset managed by Sinergise (https://registry.opendata.aws/copernicus-dem/). Processing steps: The original Copernicus GLO-30 DEM contains a relevant percentage of tiles with non-square pixels. We created a mosaic map in a https://gdal.org/drivers/raster/vrt.html format and defined within the VRT file the rule to apply cubic resampling while reading the data, i.e. importing them into GRASS GIS for further processing. We chose cubic instead of bilinear resampling since the height-width ratio of non-square pixels is up to 1:5. Hence, artefacts between adjacent tiles in rugged terrain could be minimized: gdalbuildvrt -input_file_list list_geotiffs_MOOD.csv -r cubic -tr 0.000277777777777778 0.000277777777777778 Copernicus_DSM_30m_MOOD.vrt In order to reduce the spatial resolution to 30 arc seconds, weighted resampling was performed in GRASS GIS (using r.resamp.stats) and the pixel values were scaled with 1000 (storing the pixels as integer values) for data volume reduction. In addition, a hillshade raster map was derived from the resampled elevation map (using r.relief, GRASS GIS). Eventually, we exported the elevation and hillshade raster maps in Cloud Optimized GeoTIFF (COG) format, along with SLD and QML style files.
-
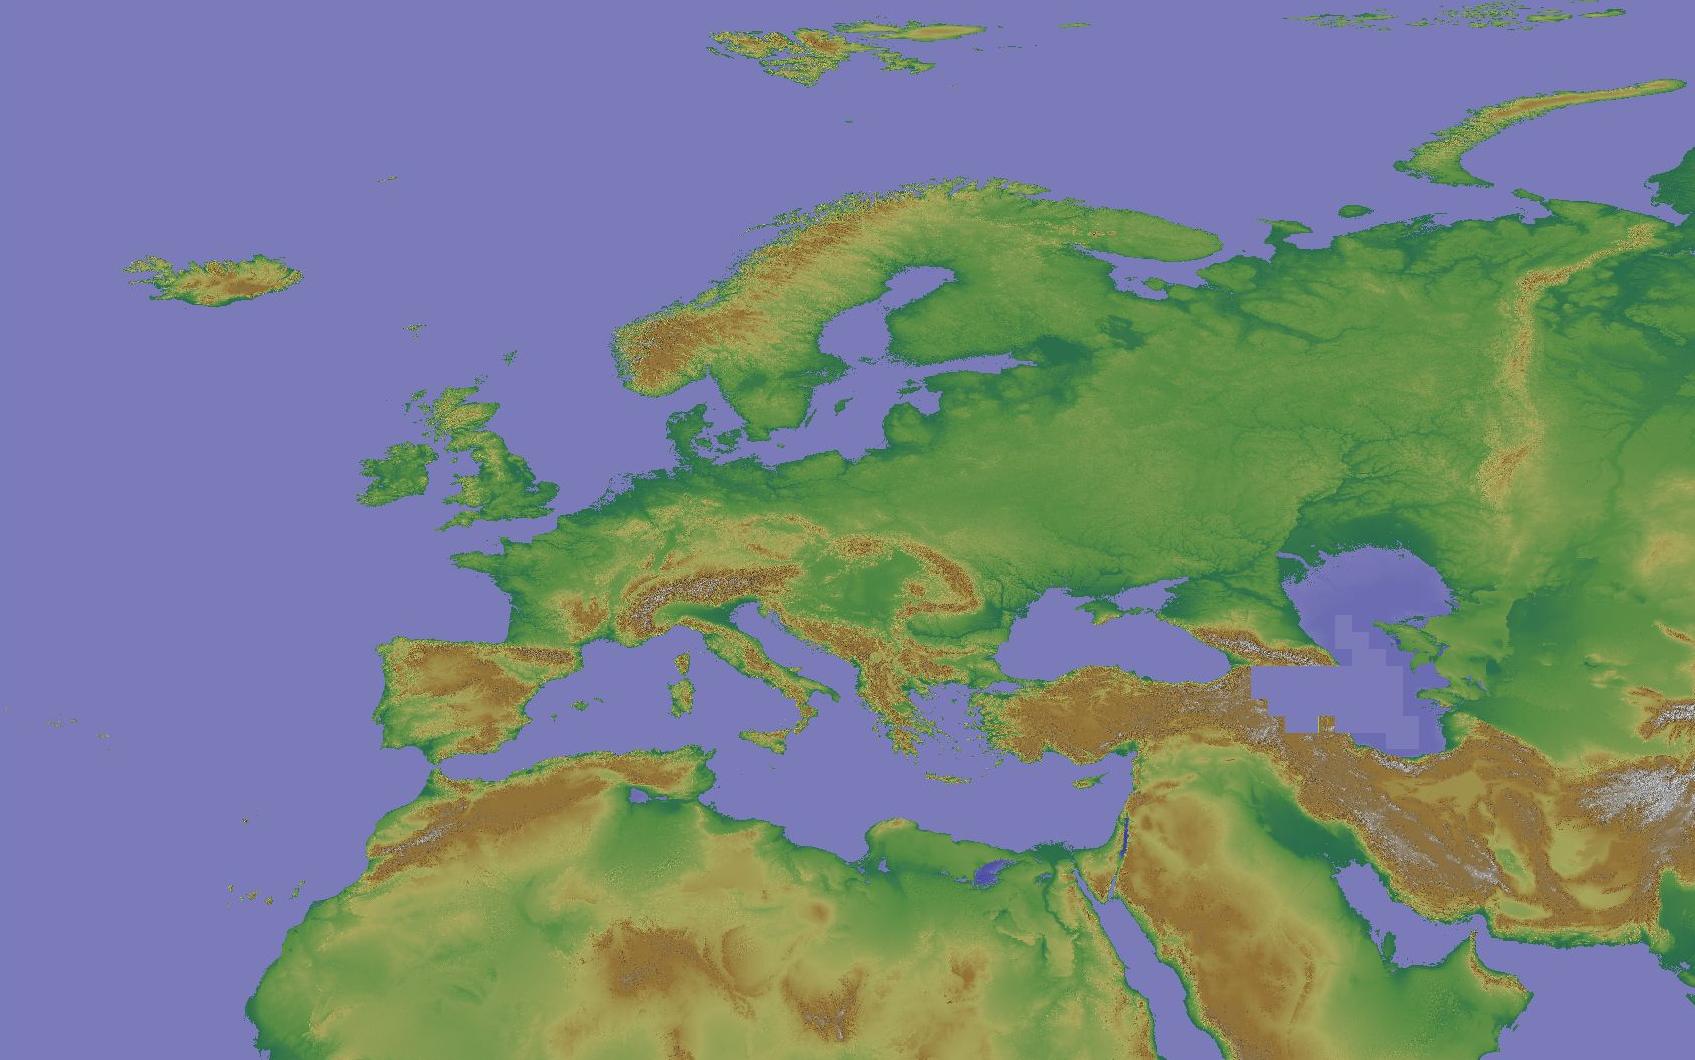
The Copernicus DEM is a Digital Surface Model (DSM) which represents the surface of the Earth including buildings, infrastructure and vegetation. The original GLO-30 provides worldwide coverage at 30 meters (refers to 10 arc seconds). Note that ocean areas do not have tiles, there one can assume height values equal to zero. Data is provided as Cloud Optimized GeoTIFFs. Note that the vertical unit for measurement of elevation height is meters. The Copernicus DEM for Europe at 3 arcsec (0:00:03 = 0.00083333333 ~ 90 meter) in COG format has been derived from the Copernicus DEM GLO-30, mirrored on Open Data on AWS, dataset managed by Sinergise (https://registry.opendata.aws/copernicus-dem/). Processing steps: The original Copernicus GLO-30 DEM contains a relevant percentage of tiles with non-square pixels. We created a mosaic map in https://gdal.org/drivers/raster/vrt.html format and defined within the VRT file the rule to apply cubic resampling while reading the data, i.e. importing them into GRASS GIS for further processing. We chose cubic instead of bilinear resampling since the height-width ratio of non-square pixels is up to 1:5. Hence, artefacts between adjacent tiles in rugged terrain could be minimized: gdalbuildvrt -input_file_list list_geotiffs_MOOD.csv -r cubic -tr 0.000277777777777778 0.000277777777777778 Copernicus_DSM_30m_MOOD.vrt In order to reduce the spatial resolution to 3 arc seconds, weighted resampling was performed in GRASS GIS (using r.resamp.stats -w) and the pixel values were scaled with 1000 (storing the pixels as integer values) for data volume reduction. In addition, a hillshade raster map was derived from the resampled elevation map (using r.relief, GRASS GIS). Eventually, we exported the elevation and hillshade raster maps in Cloud Optimized GeoTIFF (COG) format, along with SLD and QML style files.
-
INSPIRE View Service for Digital Terrain Model Grid Width 200 m (DGM200). The Digital Terrain Model DGM200 describes the terrain forms of the earth’s surface by means of a point quantity arranged in a regular grid, which is georeferenced to planimetry and altimetry. The grid width is 200 m. The data provided through this service covers the area of Germany. Maßstab: 1:null; Bodenauflösung: 200m; Scanauflösung (DPI): null
-
The Copernicus DEM is a Digital Surface Model (DSM) which represents the surface of the Earth including buildings, infrastructure and vegetation. The original GLO-30 provides worldwide coverage at 30 meters (refers to 10 arc seconds). Note that ocean areas do not have tiles, there one can assume height values equal to zero. Data is provided as Cloud Optimized GeoTIFFs. Note that the vertical unit for measurement of elevation height is meters. The Copernicus DEM for Europe at 1000 meter resolution (EU-LAEA projection) in COG format has been derived from the Copernicus DEM GLO-30, mirrored on Open Data on AWS, dataset managed by Sinergise (https://registry.opendata.aws/copernicus-dem/). Processing steps: The original Copernicus GLO-30 DEM contains a relevant percentage of tiles with non-square pixels. We created a mosaic map in https://gdal.org/drivers/raster/vrt.html format and defined within the VRT file the rule to apply cubic resampling while reading the data, i.e. importing them into GRASS GIS for further processing. We chose cubic instead of bilinear resampling since the height-width ratio of non-square pixels is up to 1:5. Hence, artefacts between adjacent tiles in rugged terrain could be minimized: gdalbuildvrt -input_file_list list_geotiffs_MOOD.csv -r cubic -tr 0.000277777777777778 0.000277777777777778 Copernicus_DSM_30m_MOOD.vrt In order to reproject the data to EU-LAEA projection while reducing the spatial resolution to 1000 m, bilinear resampling was performed in GRASS GIS (using r.proj) and the pixel values were scaled with 1000 (storing the pixels as Integer values) for data volume reduction. In addition, a hillshade raster map was derived from the resampled elevation map (using r.relief, GRASS GIS). Eventually, we exported the elevation and hillshade raster maps in Cloud Optimized GeoTIFF (COG) format, along with SLD and QML style files.
-
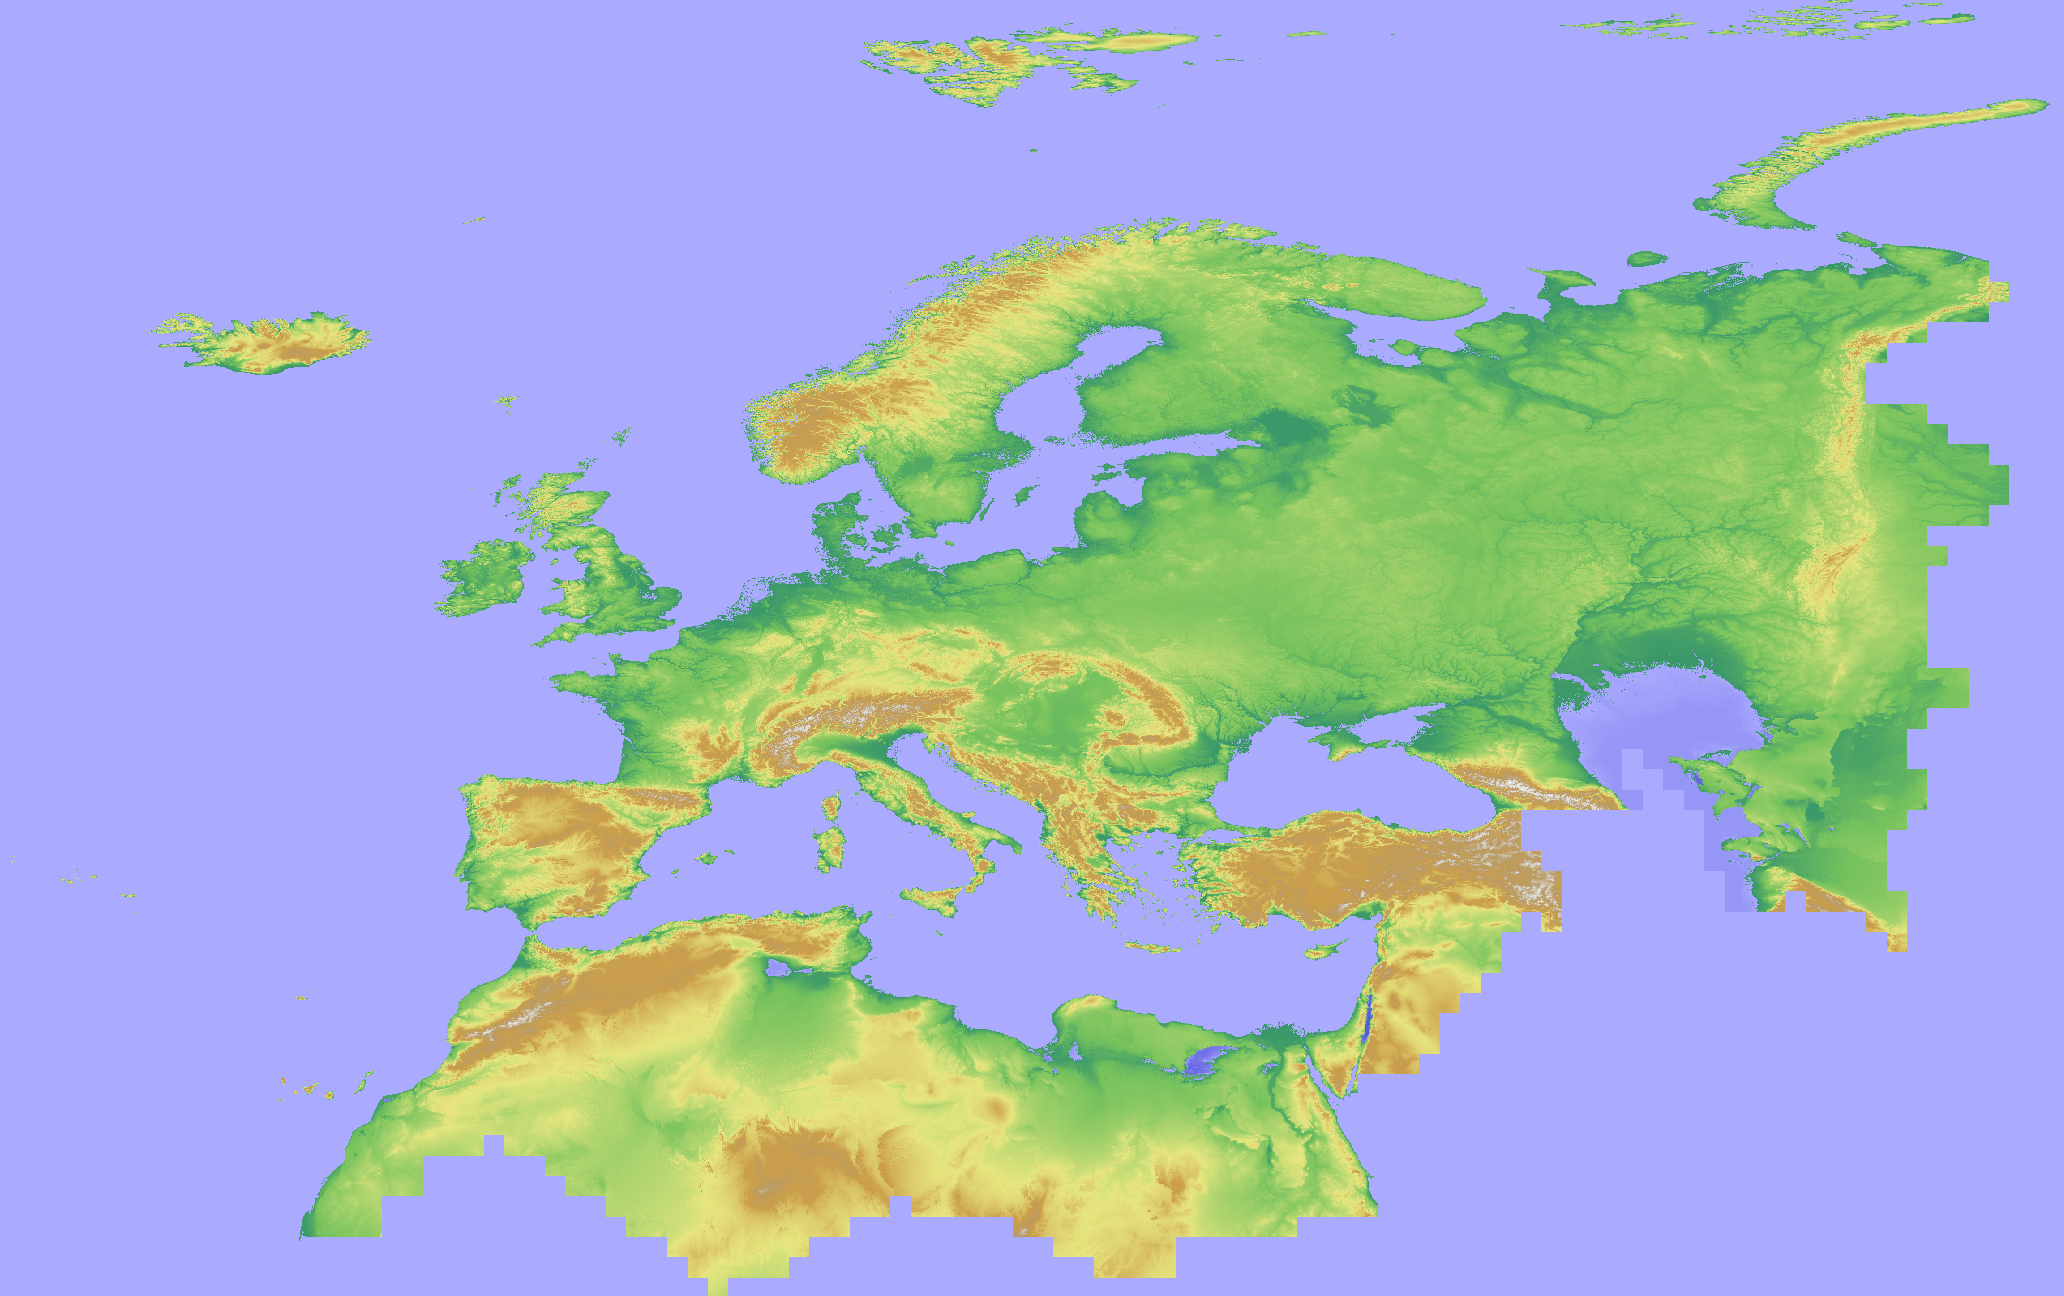
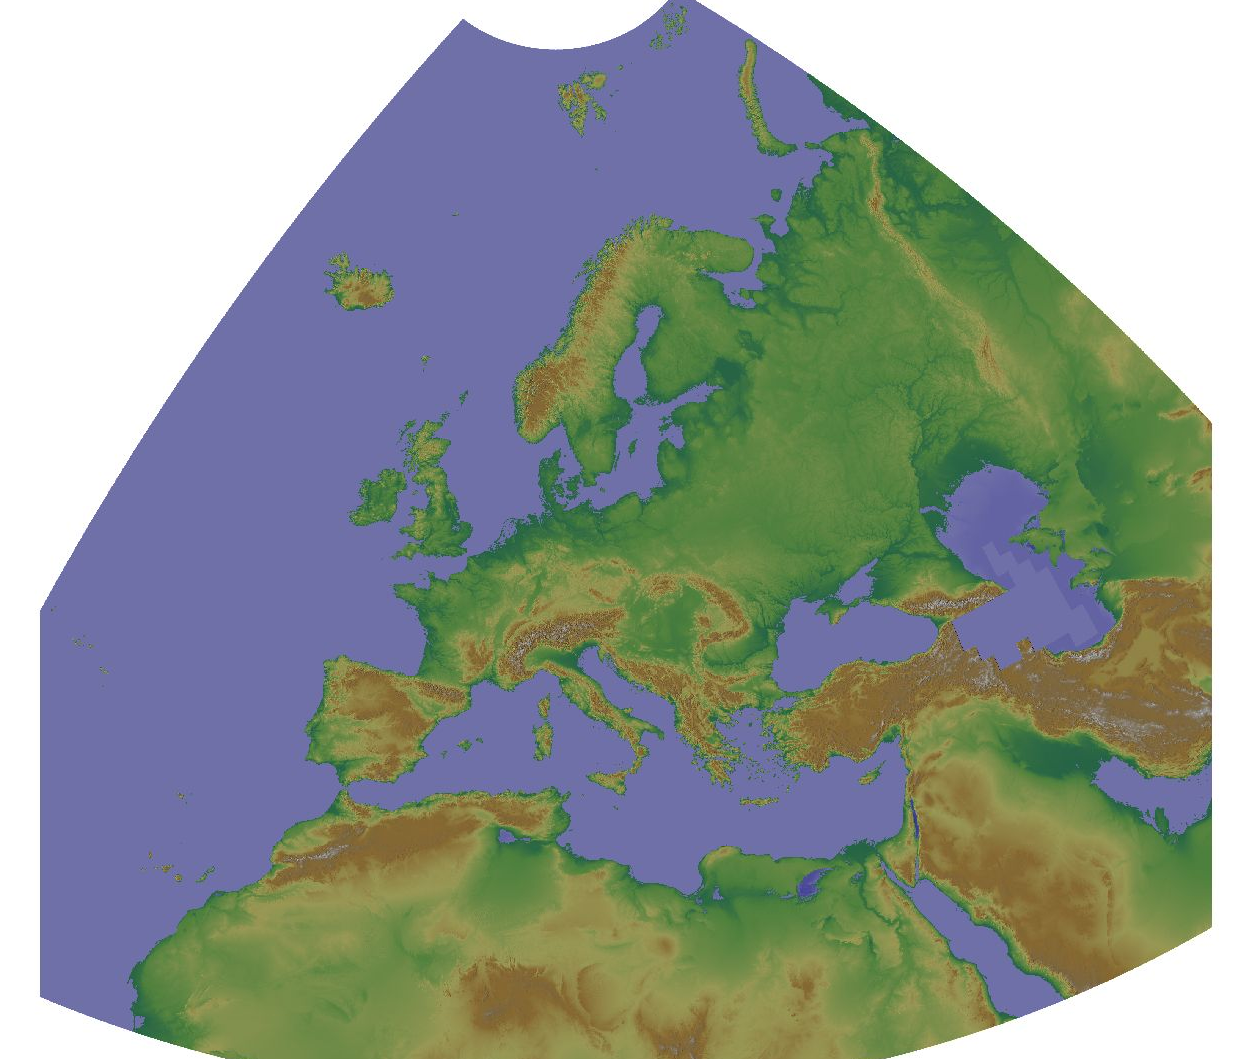
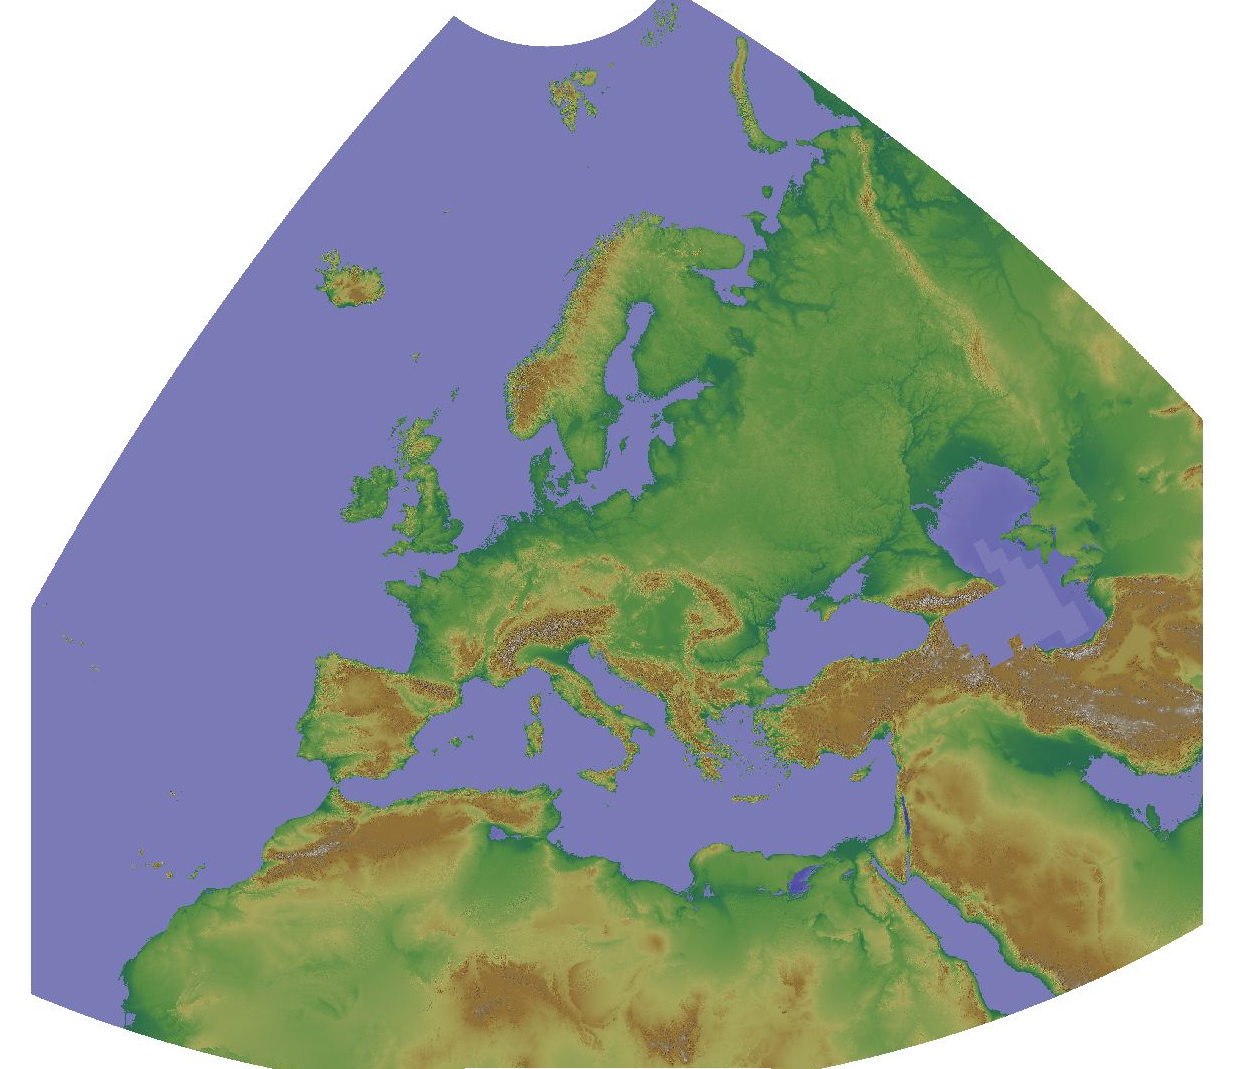
Here we provide a mosaic of the Copernicus DEM 30m for Europe and the corresponding hillshade derived from the GLO-30 public instance of the Copernicus DEM. The CRS is the same as the original Copernicus DEM CRS: EPSG:4326. Note that GLO-30 Public provides limited coverage at 30 meters because a small subset of tiles covering specific countries are not yet released to the public by the Copernicus Programme. Note that ocean areas do not have tiles, there one can assume height values equal to zero. Data is provided as Cloud Optimized GeoTIFFs. The Copernicus DEM is a Digital Surface Model (DSM) which represents the surface of the Earth including buildings, infrastructure and vegetation. The original GLO-30 provides worldwide coverage at 30 meters (refers to 10 arc seconds). Note that ocean areas do not have tiles, there one can assume height values equal to zero. Data is provided as Cloud Optimized GeoTIFFs. Note that the vertical unit for measurement of elevation height is meters. The Copernicus DEM for Europe at 30 m in COG format has been derived from the Copernicus DEM GLO-30, mirrored on Open Data on AWS, dataset managed by Sinergise (https://registry.opendata.aws/copernicus-dem/). Processing steps: The original Copernicus GLO-30 DEM contains a relevant percentage of tiles with non-square pixels. We created a mosaic map in https://gdal.org/drivers/raster/vrt.html format and defined within the VRT file the rule to apply cubic resampling while reading the data, i.e. importing them into GRASS GIS for further processing. We chose cubic instead of bilinear resampling since the height-width ratio of non-square pixels is up to 1:5. Hence, artefacts between adjacent tiles in rugged terrain could be minimized: gdalbuildvrt -input_file_list list_geotiffs_MOOD.csv -r cubic -tr 0.000277777777777778 0.000277777777777778 Copernicus_DSM_30m_MOOD.vrt The pixel values were scaled with 1000 (storing the pixels as integer values) for data volume reduction. In addition, a hillshade raster map was derived from the resampled elevation map (using r.relief, GRASS GIS). Eventually, we exported the elevation and hillshade raster maps in Cloud Optimized GeoTIFF (COG) format, along with SLD and QML style files.
-
The Copernicus DEM is a Digital Surface Model (DSM) which represents the surface of the Earth including buildings, infrastructure and vegetation. The original GLO-30 provides worldwide coverage at 30 meters (refers to 10 arc seconds). Note that ocean areas do not have tiles, there one can assume height values equal to zero. Data is provided as Cloud Optimized GeoTIFFs. Note that the vertical unit for measurement of elevation height is meters. The Copernicus DEM for Europe at 100 meter resolution (EU-LAEA projection) in COG format has been derived from the Copernicus DEM GLO-30, mirrored on Open Data on AWS, dataset managed by Sinergise (https://registry.opendata.aws/copernicus-dem/). Processing steps: The original Copernicus GLO-30 DEM contains a relevant percentage of tiles with non-square pixels. We created a mosaic map in https://gdal.org/drivers/raster/vrt.html format and defined within the VRT file the rule to apply cubic resampling while reading the data, i.e. importing them into GRASS GIS for further processing. We chose cubic instead of bilinear resampling since the height-width ratio of non-square pixels is up to 1:5. Hence, artefacts between adjacent tiles in rugged terrain could be minimized: gdalbuildvrt -input_file_list list_geotiffs_MOOD.csv -r cubic -tr 0.000277777777777778 0.000277777777777778 Copernicus_DSM_30m_MOOD.vrt In order to reproject the data to EU-LAEA projection while reducing the spatial resolution to 100 m, bilinear resampling was performed in GRASS GIS (using r.proj) and the pixel values were scaled with 1000 (storing the pixels as Integer values) for data volume reduction. In addition, a hillshade raster map was derived from the resampled elevation map (using r.relief GRASS GIS). Eventually, we exported the elevation and hillshade raster maps in Cloud Optimized GeoTIFF (COG) format, along with SLD and QML style files.
-
Das ICP-Forests-Programm agiert im Rahmen des UNECE-Übereinkommens über weiträumige grenzüberschreitende Luftverunreinigungen (Genfer Luftreinhaltekonvention, CLRTAP). Das Level-II-Monitoring ergänzt seit 1995 das Level-I-Monitoring. Hier werden Daten über Baumwachstum, Bodenvegetation, Bodenlösung, Bodenfestphase, nasse Deposition, Luftqualität, meteorologische Parameter, Phänologie, Streufall, Nadel- / Blattanalysen und sichtbare Ozonschäden erhoben, die umfänglich und hinsichtlich ihrer zeitlichen Auflösung weit über den Erhebungsrahmen des extensiven Waldmonitorings (Level I) hinausgehen. Die Daten werden in Deutschland auf ca. 50 - 90 Plots (Anzahl variiert je nach Parameter) erhoben. Verteilung Probenahmestandorte: Verteilung systematisch, so dass die Hauptwaldtypen Europas repräsentiert sind (kein Raster) Probenahmemethode: Die Probenahme für chemische Analysen erfolgt grundsätzlich nach Tiefenstufen. Satellitenbeprobung im Radius von 25 m mit einem inneren intensiver zu beprobenden Radius von 3 m. Für alle anderen Erhebungen ausführliche Angaben im ICP-Forests-Manual: https://www.icp-forests.net/monitoring-and-research/icp-forests-manual Entnahmetiefen: 0 bis 10 cm 20 bis 40 cm 40 bis 80 cm Untersuchungsmethode: Analysemethoden sind einheitlich festgelegt im ICP-Forests-Manual (s.o.). Untersuchungshäufigkeit: - bodenchemische Parameter alle 10 Jahre - Boden-Lösung fortlaufend - Blattnährstoffgehalte alle 2 Jahre - Baumdurchmesser und -höhen alle 5 Jahre - Boden-Vegetation mindestens alle 5 Jahre - atmosphärische Deposition fortlaufend - Bedingungen der Umgebungsluft fortlaufend - meteorologische Parameter fortlaufend - Phänologie mehrmals pro Jahr - Streufall fortlaufend - sichtbare Ozonschäden einmal pro Jahr - Kronenzustand jährlich Arbeitsgruppen / Gremien: - Expert Panel on soil and soils solution - Forest Soil Coordination Centre - Expert Panel on foliage and litterfall - Forest Foliar Coordinating Centre - Expert Panel on forest growth - Expert Panel on deposition - Working Group on ambient air quality - Expert Panel on crown condition - Ad hoc group on assessment of biotic damage causes - Expert panel on meteorology and phenology - Expert panel on biodiversity and ground vegetation - Quality Assurance Committee - Project Coordinating Group (PCG) - Scientific Advisory Group (SAG)