 My GeoNetwork catalogue
ENVISAT
Provided by
Type of resources
Topics
Keywords
Contact for the resource
Update frequencies
-
The "climate" water vapor product developed within ESA's "GOME-Evolution" project provides a consistent time series of monthly mean global maps of total column water vapor derived from the satellite instruments GOME, SCIAMACHY, and GOME-2 (Metop-A). Consistency amongst the different instruments (including cloud treatment) is substantially improved by (1) merging SCIAMACHY and GOME-2 observations to GOME pixel size, and (2) reducing the GOME-2 swath width to GOME/SCIAMACHY swath, thereby mimicking GOME-like observation conditions for all three sensors. This is Version 2.2
-
The "climate" water vapor product developed within ESA's "GOME-Evolution" project provides a consistent time series of monthly mean global maps of total column water vapor derived from the satellite instruments GOME, SCIAMACHY, and GOME-2 (Metop-A). Consistency amongst the different instruments (including cloud treatment) is substantially improved by (1) merging SCIAMACHY and GOME-2 observations to GOME pixel size, and (2) reducing the GOME-2 swath width to GOME/SCIAMACHY swath, thereby mimicking GOME-like observation conditions for all three sensors. Use version >2.2 instead! doi:10.1594/WDCC/GOME-EVL_water_vapor_clim_v2.2
-
The MPIC/DLR "climate" water vapor product, developed within ESA's "GOME Evolution" project, provides a consistent time series of monthly mean H2O columns from the satellite instruments GOME, SCIAMACHY, and GOME-2 (MetopA). Consistency amongst the different instruments (including cloud treatment) is substantially improved by (1) merging SCIAMACHY and GOME-2 observations to GOME pixel size, and (2) reducing the GOME-2 swath width to GOME/SCIAMACHY swath, thereby mimicking GOME-like observation conditions for all three sensors. WARNING: Version 1.0 is based on spectral analysis settings which have slightly changed during the GOME-2 timeseries, introducing a small but clear "jump" in the TCWV timeseries at the turn of the years 2012/2013. This version should not be used any more! Use version >2.2 instead! doi:10.1594/WDCC/GOME-EVL_water_vapor_clim_v2.2
-

The Medium Resolution Imaging Spectrometer (MERIS) on Board ESA’s ENVISAT provides spectral high resolution image data in the visible-near infrared spectral region (412-900 nm) at a spatial resolution of 300 m. For more details on ENVISAT and MERIS see http://envisat.esa.int/ This product developed in the frame of the MAPP project (MERIS Application and Regional Products Projects) represents the chlorophyll concentration of the North Sea derived from MERIS data. The product is a cooperative effort of DLR-DFD and the Institute for Coastal Research at the GKSS Research Centre Geesthacht. DFD pre-processed up to the value added level whenever MERIS data for the North Sea region was received and positively checked for a water area large enough for a suitable interpretation. For more details the reader is referred to http://wdc.dlr.de/sensors/meris/ and http://wdc.dlr.de/sensors/meris/documents/Mapp_ATBD_final_i3r0dez2001.pdf This product provides monthly maps.
-

The "AVHRR compatible Normalized Difference Vegetation Index derived from MERIS data (MERIS_AVHRR_NDVI)" was developed in a co-operative effort of DLR (German Remote Sensing Data Centre, DFD) and Brockmann Consult GmbH (BC) in the frame of the MAPP project (MERIS Application and Regional Products Projects). For the generation of regional specific value added MERIS level-3 products, MERIS full-resolution (FR) data are processed on a regular (daily) basis using ESA standard level-1b and level-2 data as input. The regular reception of MERIS-FR data is realized at DFD ground station in Neustrelitz. The Medium Resolution Imaging MERIS on Board ESA's ENVISAT provides spectral high resolution image data in the visible-near infrared spectral region (412-900 nm) at a spatial resolution of 300 m. For more details on ENVISAT and MERIS see http://envisat.esa.int The Advanced Very High Resolution Radiometer (AVHRR) compatible vegetation index (MERIS_AVHRR_NDVI) derived from data of the MEdium Resolution Imaging Spectrometer (MERIS) is regarded as a continuity index with 300 meter resolution for the well-known Normalized Difference Vegetation Index (NDVI) derived from AVHRR (given in 1km spatial resolution). The NDVI is an important factor describing the biological status of canopies. This product is thus used by scientists for deriving plant and canopy parameters. Consultants use time series of the NDVI for advising farmers with best practice. For more details the reader is referred to http://wdc.dlr.de/sensors/meris/ and http://wdc.dlr.de/sensors/meris/documents/Mapp_ATBD_final_i3r0dez2001.pdf This product provides daily maps.
-
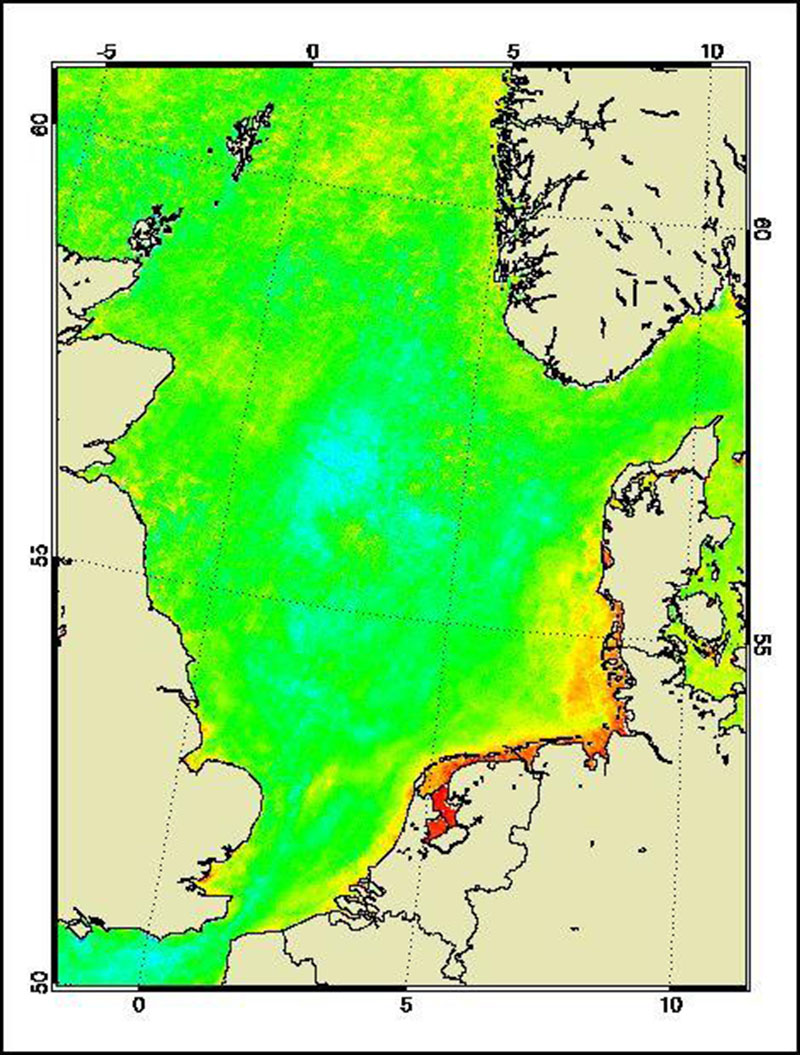
The Medium Resolution Imaging Spectrometer (MERIS) on Board ESA’s ENVISAT provides spectral high resolution image data in the visible-near infrared spectral region (412-900 nm) at a spatial resolution of 300 m. For more details on ENVISAT and MERIS see http://envisat.esa.int/ This product developed in the frame of the MAPP project (MERIS Application and Regional Products Projects) represents the chlorophyll concentration of the North Sea derived from MERIS data. The product is a cooperative effort of DLR-DFD and the Institute for Coastal Research at the GKSS Research Centre Geesthacht. DFD pre-processed up to the value added level whenever MERIS data for the North Sea region was received and positively checked for a water area large enough for a suitable interpretation. For more details the reader is referred to http://wdc.dlr.de/sensors/meris/ and http://wdc.dlr.de/sensors/meris/documents/Mapp_ATBD_final_i3r0dez2001.pdf This product provides daily maps.
-
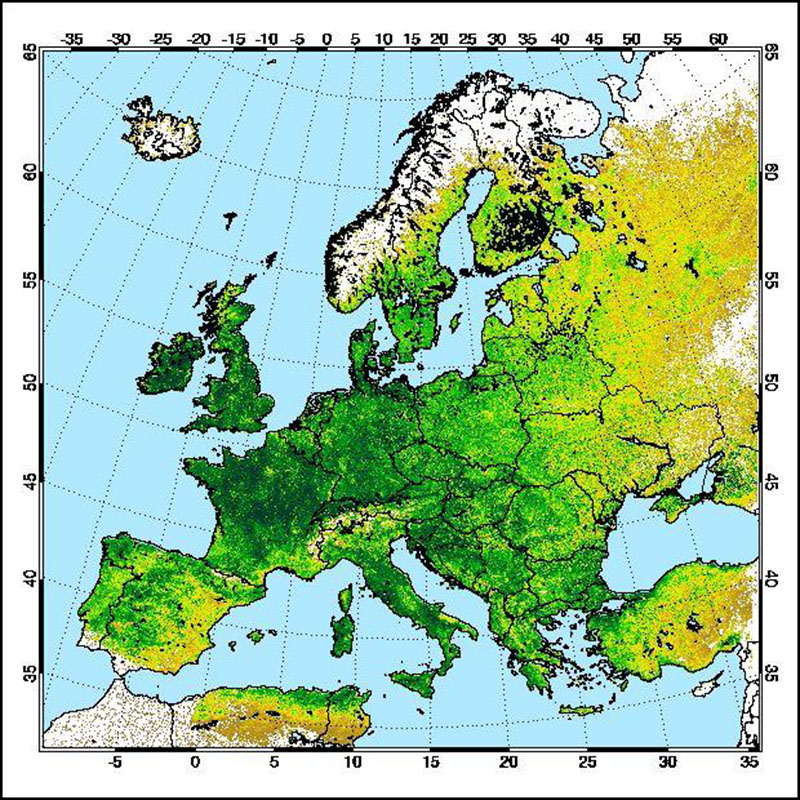
The "AVHRR compatible Normalized Difference Vegetation Index derived from MERIS data (MERIS_AVHRR_NDVI)" was developed in a co-operative effort of DLR (German Remote Sensing Data Centre, DFD) and Brockmann Consult GmbH (BC) in the frame of the MAPP project (MERIS Application and Regional Products Projects). For the generation of regional specific value added MERIS level-3 products, MERIS full-resolution (FR) data are processed on a regular (daily) basis using ESA standard level-1b and level-2 data as input. The regular reception of MERIS-FR data is realized at DFD ground station in Neustrelitz. The Medium Resolution Imaging MERIS on Board ESA's ENVISAT provides spectral high resolution image data in the visible-near infrared spectral region (412-900 nm) at a spatial resolution of 300 m. For more details on ENVISAT and MERIS see http://envisat.esa.int The Advanced Very High Resolution Radiometer (AVHRR) compatible vegetation index (MERIS_AVHRR_NDVI) derived from data of the MEdium Resolution Imaging Spectrometer (MERIS) is regarded as a continuity index with 300 meter resolution for the well-known Normalized Difference Vegetation Index (NDVI) derived from AVHRR (given in 1km spatial resolution). The NDVI is an important factor describing the biological status of canopies. This product is thus used by scientists for deriving plant and canopy parameters. Consultants use time series of the NDVI for advising farmers with best practice. For more details the reader is referred to http://wdc.dlr.de/sensors/meris/ and http://wdc.dlr.de/sensors/meris/documents/Mapp_ATBD_final_i3r0dez2001.pdf This product provides monthly maps.