 My GeoNetwork catalogue
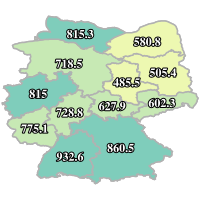
precipitation
Provided by
Type of resources
Available actions
Topics
Keywords
Contact for the resource
Update frequencies
Service types
-
Grids are derived from DWD stations and legally and qualitatively equivalent partner stations in Germany run for climatological and climate related applications, considering the height dependencies.
-
The ISRD43 TTAAii Data Designators decode as: T1 (I): Observational data (Binary coded) - BUFR T1T2 (IS): Surface/sea level T1T2A1 (ISR): Hydrologic reports A2 (D): 90°E - 0° northern hemisphere (Remarks from Volume-C: ANKONDA - Area of Offenbach/Essen - international part)
-
Gridded data of daily precipitation with 1 km horizontal resolution provided by the hydrometeorology of Deutscher Wetterdienst. Information about the REGNIE product (de.dwd.hydromet.regnie.daily.data): data handling and product description.
-
The ISRD41 TTAAii Data Designators decode as: T1 (I): Observational data (Binary coded) - BUFR T1T2 (IS): Surface/sea level T1T2A1 (ISR): Hydrologic reports A2 (D): 90°E - 0° northern hemisphere (Remarks from Volume-C: ANKONDA - Area of Hamburg - international part)
-
The ISOD43 TTAAii Data Designators decode as: T1 (I): Observational data (Binary coded) - BUFR T1T2 (IS): Surface/sea level A2 (D): 90°E - 0° northern hemisphere (Remarks from Volume-C: ANKONDA - Area of Offenbach/Essen - national part)
-
The ISOD42 TTAAii Data Designators decode as: T1 (I): Observational data (Binary coded) - BUFR T1T2 (IS): Surface/sea level A2 (D): 90°E - 0° northern hemisphere (Remarks from Volume-C: ANKONDA - Area of Potsdam/Leipzig - national part)
-
BfG MapService 'CC_GAR_Prec_2000_2100', OGC:WMS 1.3.0; The maps and data sets summarise climate change information resulting from a well defined ensemble of 14 regional climate simulations (mainly based on EU-ENSEMBLES) for periods 2021 to 2050 and 2071 to 2100. The information are expressed as change of air temperature and precipitation with respect to the simulated present (1971-2000) averaged over meteorological seasons and 50km grid boxes. Based on the ensemble, a high, central and low estimate of the possible future development is given.
-
BfG MapService 'CC_GAR_Temp_2000_2100', OGC:WMS 1.3.0; The maps and data sets summarise climate change information resulting from a well defined ensemble of 14 regional climate simulations (mainly based on EU-ENSEMBLES) for periods 2021 to 2050 and 2071 to 2100. The information are expressed as change of air temperature and precipitation with respect to the simulated present (1971-2000) averaged over meteorological seasons and 50km grid boxes. Based on the ensemble, a high, central and low estimate of the possible future development is given.
-
The ISRD44 TTAAii Data Designators decode as: T1 (I): Observational data (Binary coded) - BUFR T1T2 (IS): Surface/sea level T1T2A1 (ISR): Hydrologic reports A2 (D): 90°E - 0° northern hemisphere (Remarks from Volume-C: ANKONDA - Area of München/Stuttgart - international part)
-
Gridded data of daily precipitation with 1 km horizontal resolution provided by the hydrometeorology of Deutscher Wetterdienst. The data are combined as arc-Files of one year. For data handling and product description see de.dwd.hydromet.regnie.daily.info (only available in German). Please use the Software-Download under Miscellaneous -> Tools -> REGNIE to handle the arc Files.