 My GeoNetwork catalogue
time-series
Provided by
Type of resources
Available actions
Topics
Keywords
Contact for the resource
Update frequencies
-

The product is automatically derived from Sentinel-3 (OLCI) satellite imagery in near-real time. It is an incremental product, meaning that the retrieved results are updated as soon as new input data becomes available over a timespan of ten days. Besides the fire perimeter, and detection time each feature contains information about the severity of the burning.
-
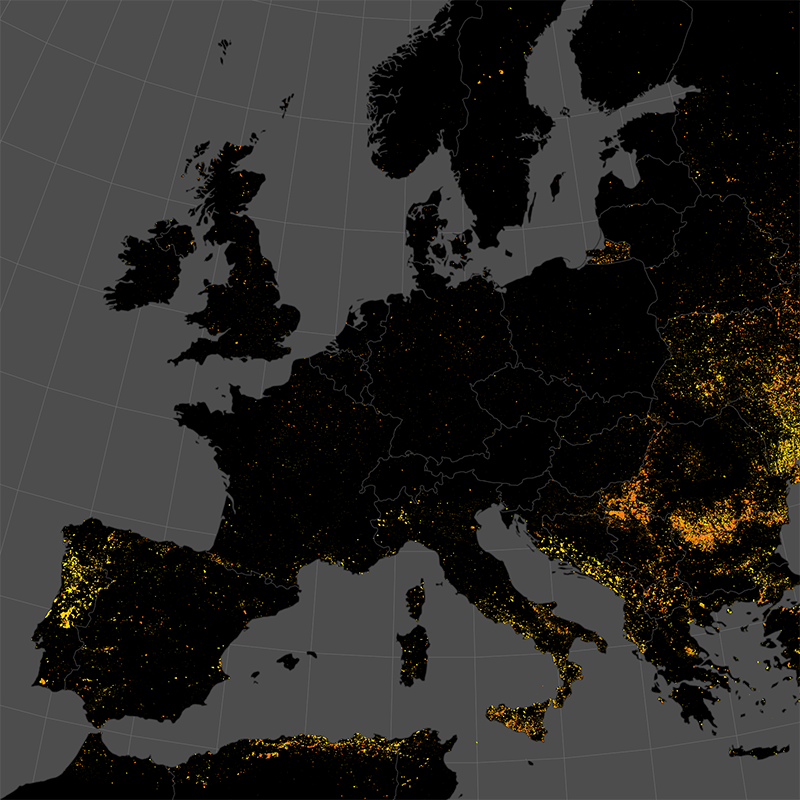
This data set represents the monthly, accumulated results of the final (10-day) version of the fire perimeters from the "Burnt Area Daily NRT Incremental Product - Europe, Sentinel-3" dataset. The burn perimeters are spatially and temporally correlated, so that interrelated detections from consecutive observations are combined into a single feature. A perimeter is interpreted as belonging to a given event if a spatial overlap exists within a time frame of 15 days. Besides the geometry, attribute information is also combined while considering the size of the perimeter as a weighting factor. Each feature contains information about the final fire perimeter, Date/Time of the first detection, and the averaged burn severity.
-
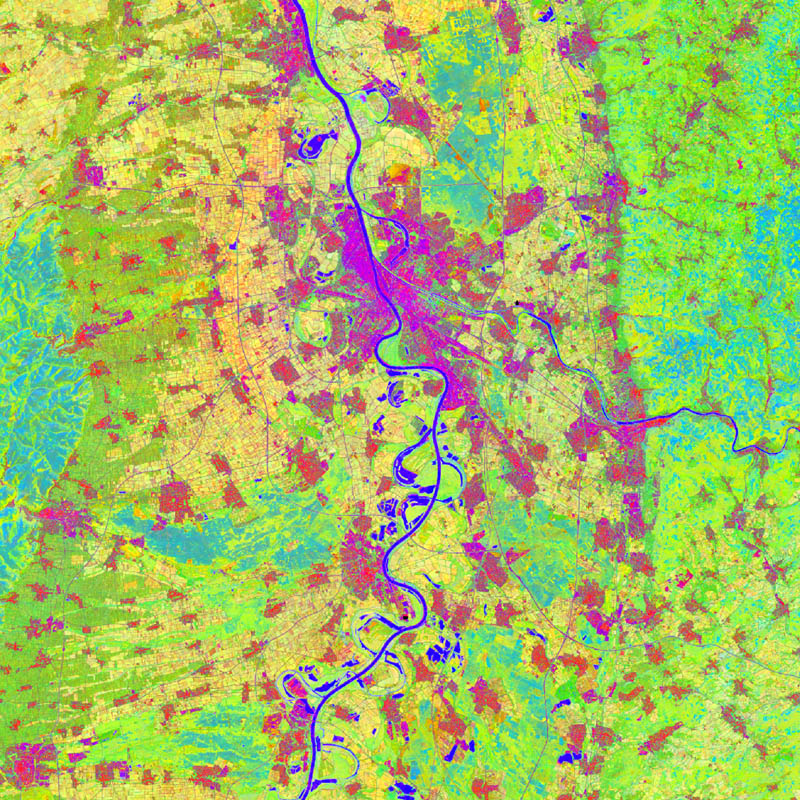
The TimeScan product is based on the fully-automated analysis of comprehensive time-series acquisitions of Landsat data. Based on a user-specified definition of the required period of time, the region of interest and – optionally – the maximum cloud cover, the TimeScan processor starts with the collection of all available Landsat scenes that meet the user specification. Next, for each single scene masking of clouds, haze and shadow is conducted using the Fmask algorithm. Then, a total of 6 indices is calculated for those pixels of each single scene that have not been masked in the prior step. The set of indices includes the Normalized Difference Vegetation Index (NDVI), the Built-up Index (BI), the Modified Normalized Difference Water Index (MNDWI), the Normalized Difference Band-5 / Band-7 (ND57), the Normalized Difference Band-4 / Band-3 (ND43), and the Normalized Difference Band-3 / Band-2 (ND32). Finally, the TimeScan product is generated by calculating the temporal statistics (minimum, maximum, mean, standard deviation, mean slope) for each index over the defined period of time. Hence, in case of the defined 6 indices chosen, the TimeScan product will include a total of 30 bands (5 statistical features per index). As an additional band a quality layer is added which shows for each pixel the number of valid values (meaning times with no cloud/haze or shadow cover) that have been included in the statistics calculation.
-

The product is automatically derived from Aqua/Terra (MODIS) satellite imagery in near-real time. It is an incremental product, meaning that the retrieved results are updated as soon as new input data becomes available over a timespan of ten days. Besides the fire perimeter and detection time, each feature contains information about the severity of the burning.
-
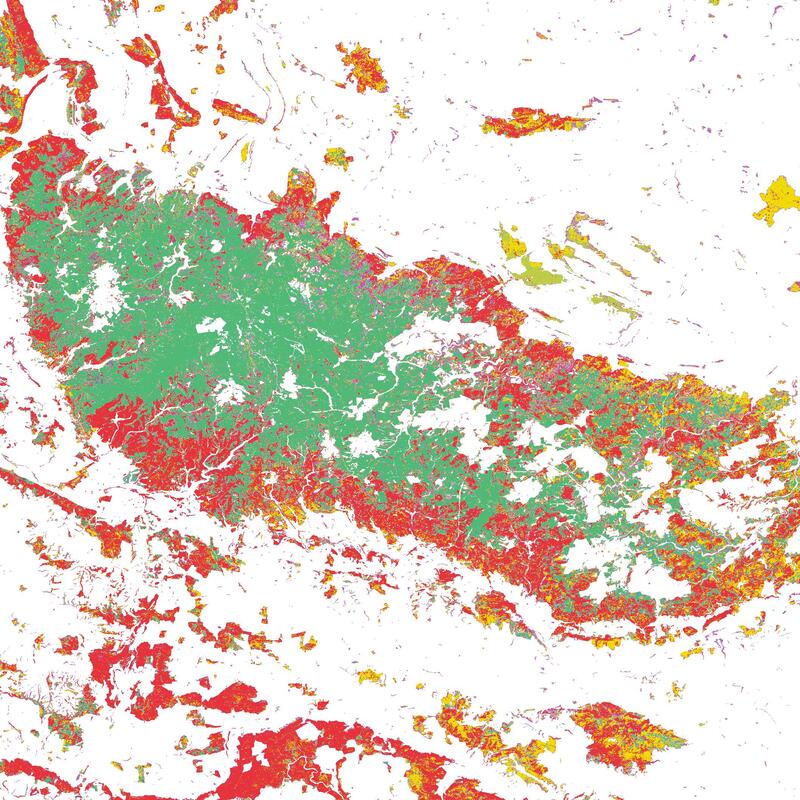
The Tree Species Germany product provides a map of dominant tree species across Germany for the year 2016 at a spatial resolution of 10 meters. The map depicts the distribution of ten tree species groups derived from multi-temporal optical Sentinel-2 data. The input features explicitly incorporate phenological information to capture seasonal vegetation dynamics relevant for species discrimination. A total of over 100,000 training and test samples were compiled from publicly accessible sources, including urban tree inventories, Google Earth Pro, Google Street View, and field observations. The final product was created by majority-voting on annual XGBoost Sentinel-2 tree species classifications (2016–2024) and filtering with forest structure data. If no clear majority vote was achieved, the class uncertain was assigned. The Tree Species Germany 2016 product achieves an overall F1-score of 0.95. For the dominant species pine, spruce, beech, and oak, class-wise F1-scores range from 0.92 to 0.99, while F1-scores for other widespread species such as birch, alder, larch, Douglas fir, fir, and other deciduous species range from 0.85 to 0.96. The product provides a consistent, high-resolution, and up-to-date representation of tree species distribution across Germany. Its transferable, cost-efficient, and repeatable methodology enables reliable large-scale forest monitoring and offers a valuable basis for assessing spatial patterns and temporal changes in forest composition in the context of ongoing climatic and environmental dynamics.
-
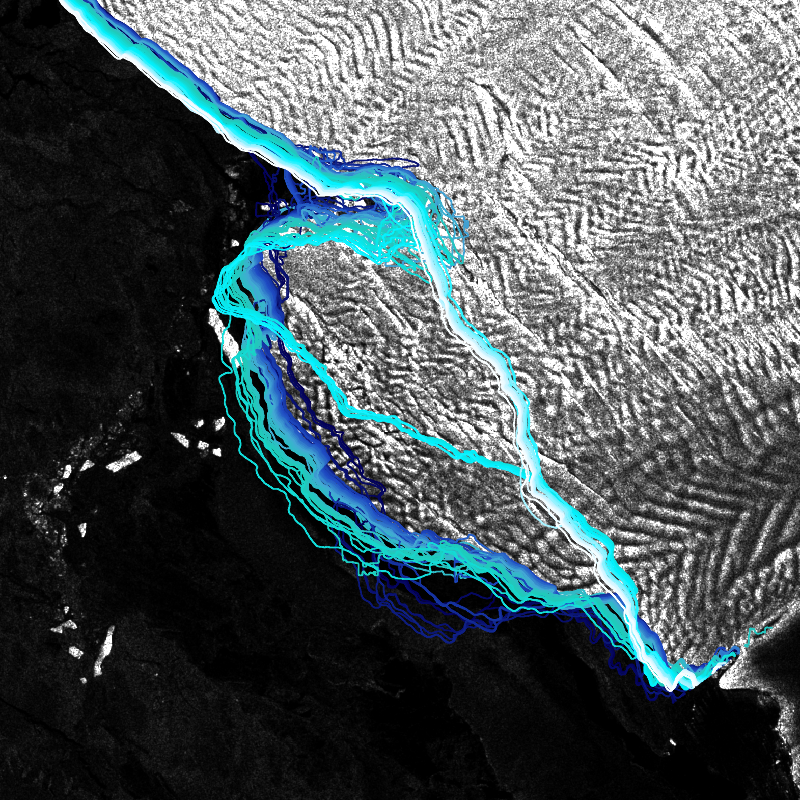
IceLines (Ice Shelf and Glacier Front Time Series) is an automated calving front monitoring service providing monthly ice shelf front time series of major Antarctic ice shelves. The provided time series allows to discover the dynamics of ice shelf front changes and calving events. The front positions are automatically derived from Sentinel-1 data based on a deep neuronal network called HED-U-Net. The time series covers the timespan 2014 to today (partly limited due to Sentinel-1 data availability). Incorrectly extracted fronts are truncated which might lead to gaps in the time series especially between December to March due to strong surface melt. Annual averages are calculated based on the extracted monthly fronts (excluding the summer months) and provide more robust results due to temporal aggregation
-

The Tree Species Germany product provides a map of dominant tree species across Germany for the year 2022 at a spatial resolution of 10 meters. The map depicts the distribution of ten tree species groups derived from multi-temporal optical Sentinel-2 data, radar data from Sentinel-1, and a digital elevation model. The input features explicitly incorporate phenological information to capture seasonal vegetation dynamics relevant for species discrimination. A total of over 80,000 training and test samples were compiled from publicly accessible sources, including urban tree inventories, Google Earth Pro, Google Street View, and field observations. The final classification was generated using an XGBoost machine learning algorithm. The Tree Species Germany product achieves an overall F1-score of 0.89. For the dominant species pine, spruce, beech, and oak, class-wise F1-scores range from 0.76 to 0.98, while F1-scores for other widespread species such as birch, alder, larch, Douglas fir, and fir range from 0.88 to 0.96. The product provides a consistent, high-resolution, and up-to-date representation of tree species distribution across Germany. Its transferable, cost-efficient, and repeatable methodology enables reliable large-scale forest monitoring and offers a valuable basis for assessing spatial patterns and temporal changes in forest composition in the context of ongoing climatic and environmental dynamics.
-

This data set represents the yearly, accumulated results of the final (10-day) version of the fire perimeters from the "Burnt Area Daily NRT Incremental Product - Europe, Sentinel-3" dataset. The burn perimeters are spatially and temporally correlated, so that interrelated detections from consecutive observations are combined into a single feature. A perimeter is interpreted as belonging to a given event if a spatial overlap exists within a time frame of 15 days. Besides the geometry, attribute information is also combined while considering the size of the perimeter as a weighting factor. Each feature contains information about the final fire perimeter, Date/Time of the first detection, and the averaged burn severity