 My GeoNetwork catalogue
Landsat-7
Provided by
Type of resources
Available actions
Topics
Keywords
Contact for the resource
Update frequencies
-
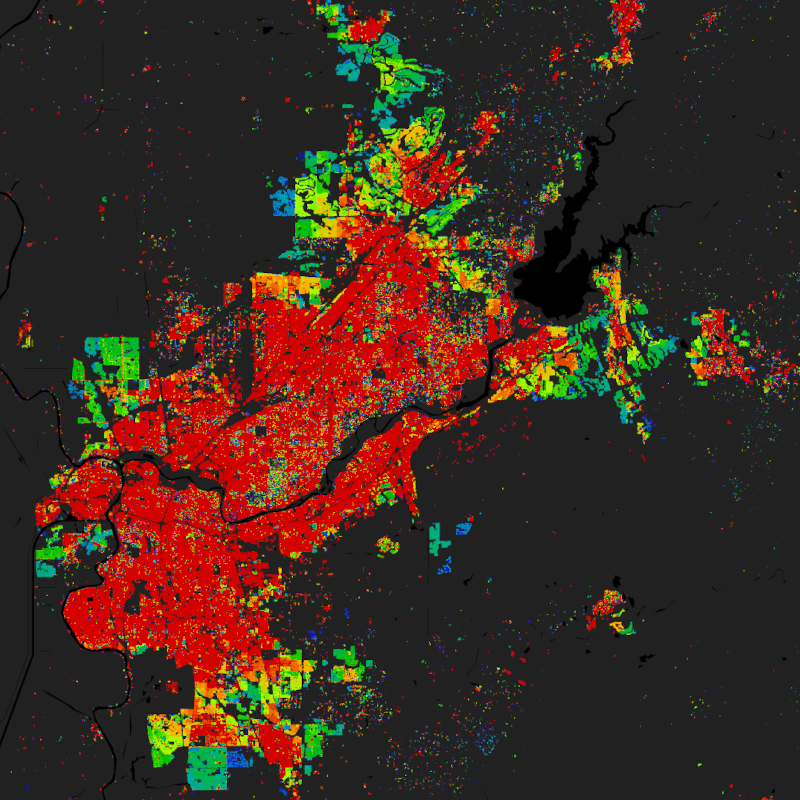
The World Settlement Footprint (WSF) 2019 is a 10m resolution binary mask outlining the extent of human settlements globally derived by means of 2019 multitemporal Sentinel-1 (S1) and Sentinel-2 (S2) imagery. Based on the hypothesis that settlements generally show a more stable behavior with respect to most land-cover classes, temporal statistics are calculated for both S1- and S2-based indices. In particular, a comprehensive analysis has been performed by exploiting a number of reference building outlines to identify the most suitable set of temporal features (ultimately including 6 from S1 and 25 from S2). Training points for the settlement and non-settlement class are then generated by thresholding specific features, which varies depending on the 30 climate types of the well-established Köppen Geiger scheme. Next, binary classification based on Random Forest is applied and, finally, a dedicated post-processing is performed where ancillary datasets are employed to further reduce omission and commission errors. Here, the whole classification process has been entirely carried out within the Google Earth Engine platform. To assess the high accuracy and reliability of the WSF2019, two independent crowd-sourcing-based validation exercises have been carried out with the support of Google and Mapswipe, respectively, where overall 1M reference labels have been collected based photointerpretation of very high-resolution optical imagery. Starting backwards from the year 2015 - for which the WSF2015 is used as a reference - settlement and non-settlement training samples for the given target year t are iteratively extracted by applying morphological filtering to the settlement mask derived for the year t+1, as well as excluding potentially mislabeled samples by adaptively thresholding the temporal mean NDBI, MNDWI and NDVI. Finally, binary Random Forest classification in performed. To quantitatively assess the high accuracy and reliability of the dataset, an extensive campaign based on crowdsourcing photointerpretation of very high-resolution airborne and satellite historical imagery has been performed with the support of Google. In particular, for the years 1990, 1995, 2000, 2005, 2010 and 2015, ~200K reference cells of 30x30m size distributed over 100 sites around the world have been labelled, hence summing up to overall ~1.2M validation samples. It is worth noting that past Landsat-5/7 availability considerably varies across the world and over time. Independently from the implemented approach, this might then result in a lower quality of the final product where few/no scenes have been collected. Accordingly, to provide the users with a suitable and intuitive measure that accounts for the goodness of the Landsat imagery, we conceived the Input Data Consistency (IDC) score, which ranges from 6 to 1 with: 6) very good; 5) good; 4) fair; 3) moderate; 2) low; 1) very low. The IDC score is available on a yearly basis between 1985 and 2015 and supports a proper interpretation of the WSF evolution product. The WSF evolution and IDC score datasets are organized in 5138 GeoTIFF files (EPSG4326 projection) each one referring to a portion of 2x2 degree size (~222x222km) on the ground. WSF evolution values range between 1985 and 2015 corresponding to the estimated year of settlement detection, whereas 0 is no data. A comprehensive publication with all technical details and accuracy figures is currently being finalized. For the time being, please refer to Marconcini et al,. 2021.
-

This product is a vector file of the districts of the Paraguayan Chaco. It contains information on the forest cover within each district for the years 1986 until 2020. Hence, this product aggregates the information of 34 annual forest maps of the Paraguayan Chaco to a district level and provides the basis for further analysis as conducted in the following publication: https://doi.org/10.3390/f13010025
-

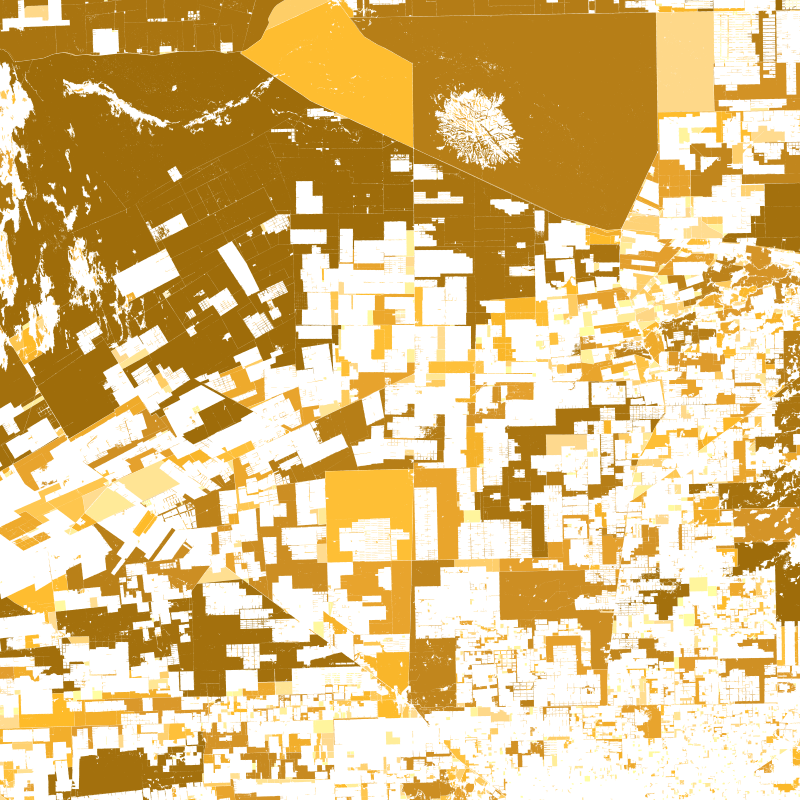
The dataset is based on the analysis of forest cover dynamics in the Paraguayan Chaco (northeastern part of Paraguay) between 1987 and 2020. The underlying forest masks were derived through annual forst classifications with a Random-Forest-Classifier trained on Landsat data from 1987 until 2020. The map shows the year in which the forest area was lost.
-
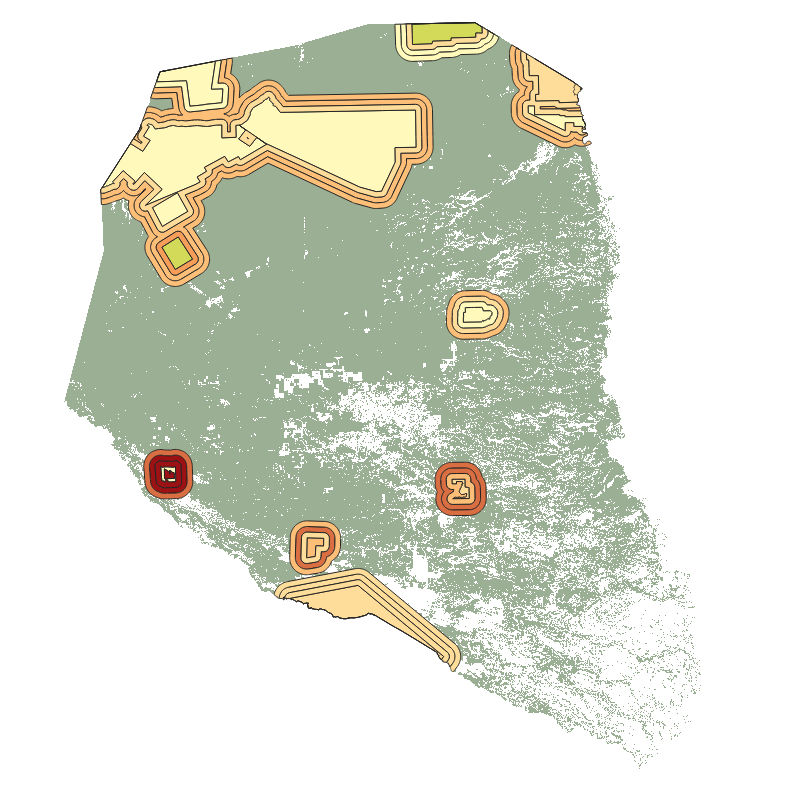
This product is a vector file of the protected areas of the Paraguayan Chaco. It contains information on the forest cover within each protected area and a 5, 10, and 15 km buffer zone around these areas, for the years 2000 until 2020. Hence, this product aggregates the information of 21 annual forest maps of the Paraguayan Chaco to the level of protected areas and provides the basis for further analysis as conducted in the following publication: https://doi.org/10.3390/f13010025
-
This product is a shape file of all detected forest patches in the Paraguayan Chaco that are larger than 10 hectars fort he years 2000, 2010, and 2020. Every forest patch contains information on its perimeter, size, shape, and core area. By looking at all forest patches together, an impression can be gained of the fragmentation of the forest in the Paraguayan Chaco. Proximity is a measure of fragmentation. Areas of large and close by forest patches show high proximity values while isolated patches or patchest hat are only surrounded by small forest patches, have a small proximity. The Core area index quantifies the share of core area in the entire forest patch area. Thereby, corea area is the area of a forest patch with at least 500m distance to the edge of the forest. The Shape index is calculated from perimeter and area of a patch. The fragementation of a forest often has the effect that the ratio between area and perimeter is affected. The edge lengths become longer while the surface area becomes smaller.