 My GeoNetwork catalogue
Paraguay
Provided by
Type of resources
Available actions
Topics
Keywords
Contact for the resource
Update frequencies
Service types
-

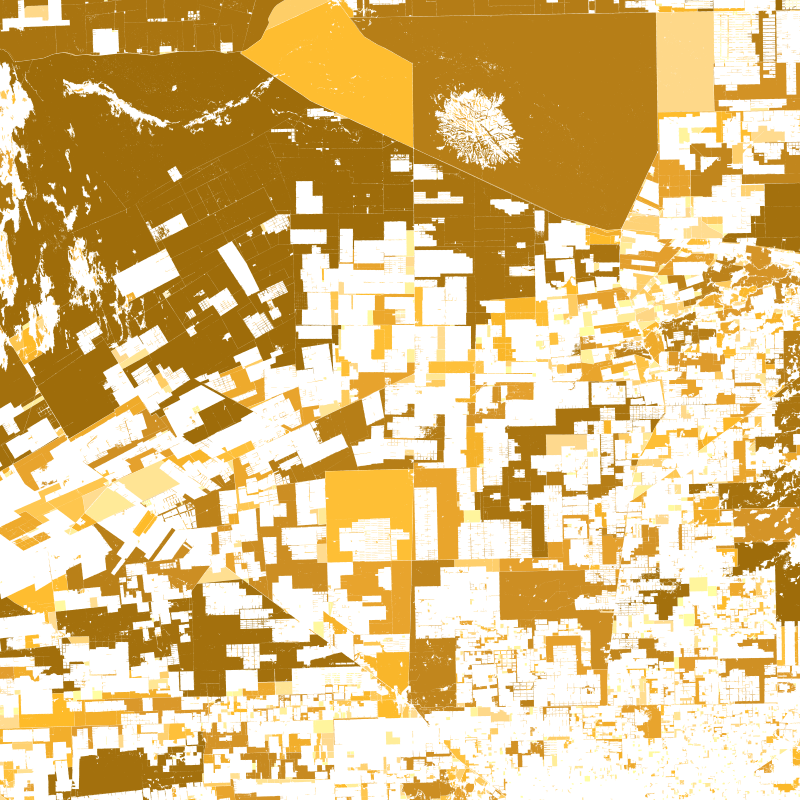
The dataset is based on the analysis of forest cover dynamics in the Paraguayan Chaco (northeastern part of Paraguay) between 1987 and 2020. The underlying forest masks were derived through annual forst classifications with a Random-Forest-Classifier trained on Landsat data from 1987 until 2020. The map shows the year in which the forest area was lost.
-
This product is a shape file of all detected forest patches in the Paraguayan Chaco that are larger than 10 hectars fort he years 2000, 2010, and 2020. Every forest patch contains information on its perimeter, size, shape, and core area. By looking at all forest patches together, an impression can be gained of the fragmentation of the forest in the Paraguayan Chaco. Proximity is a measure of fragmentation. Areas of large and close by forest patches show high proximity values while isolated patches or patchest hat are only surrounded by small forest patches, have a small proximity. The Core area index quantifies the share of core area in the entire forest patch area. Thereby, corea area is the area of a forest patch with at least 500m distance to the edge of the forest. The Shape index is calculated from perimeter and area of a patch. The fragementation of a forest often has the effect that the ratio between area and perimeter is affected. The edge lengths become longer while the surface area becomes smaller.
-

This product is a vector file of the districts of the Paraguayan Chaco. It contains information on the forest cover within each district for the years 1986 until 2020. Hence, this product aggregates the information of 34 annual forest maps of the Paraguayan Chaco to a district level and provides the basis for further analysis as conducted in the following publication: https://doi.org/10.3390/f13010025
-
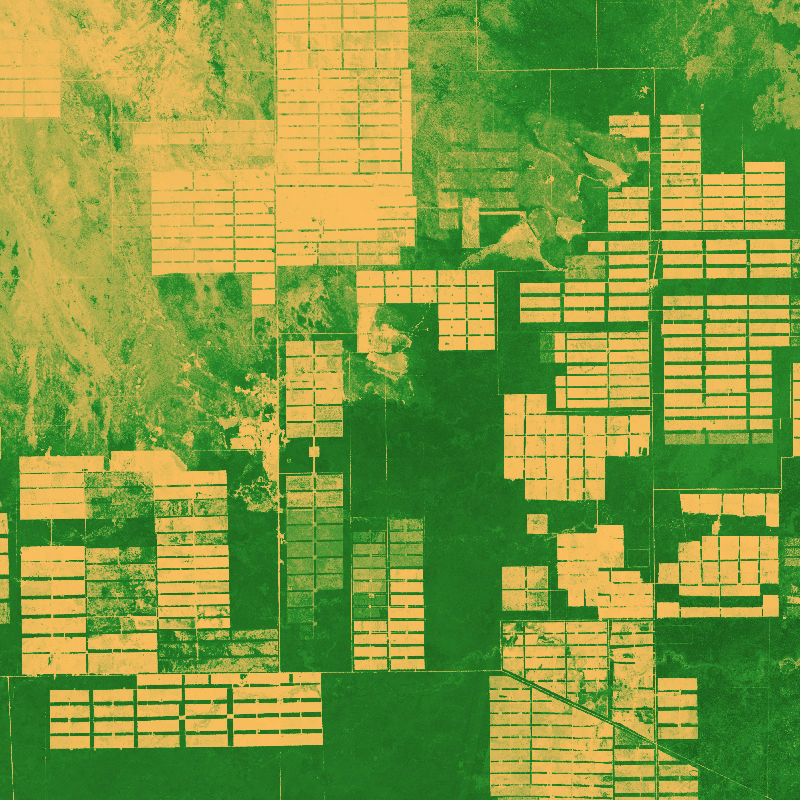
The dataset is based on an analysis combining Sentinel-1 (SAR), -2 (Multispectral) and GEDI (Global Ecosystem Dynamics Investigation, LiDAR) data to model vegetation structure information. The derived products show high-spatial resolution maps (10 m) of total canopy cover (cover density in %), Foliage height diversity (Fhd) index in meter, Plant area index (Pai) in meter and canopy height (rh95) in meter.
-
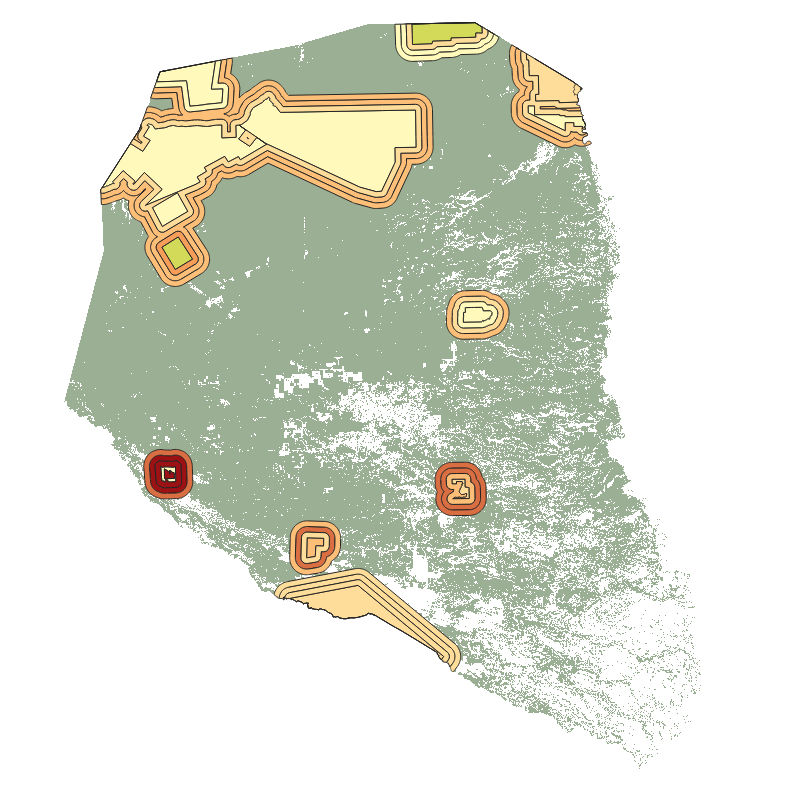
This product is a vector file of the protected areas of the Paraguayan Chaco. It contains information on the forest cover within each protected area and a 5, 10, and 15 km buffer zone around these areas, for the years 2000 until 2020. Hence, this product aggregates the information of 21 annual forest maps of the Paraguayan Chaco to the level of protected areas and provides the basis for further analysis as conducted in the following publication: https://doi.org/10.3390/f13010025
-
DWD’s fully automatic MOSMIX product optimizes and interprets the forecast calculations of the NWP models ICON (DWD) and IFS (ECMWF), combines these and calculates statistically optimized weather forecasts in terms of point forecasts (PFCs). Thus, statistically corrected, updated forecasts for the next ten days are calculated for about 5400 locations around the world. Most forecasting locations are spread over Germany and Europe. MOSMIX forecasts (PFCs) include nearly all common meteorological parameters measured by weather stations. For further information please refer to: [in German: https://www.dwd.de/DE/leistungen/met_verfahren_mosmix/met_verfahren_mosmix.html ] [in English: https://www.dwd.de/EN/ourservices/met_application_mosmix/met_application_mosmix.html ]
-

Wanderungen zwischen Deutschland und dem Ausland:Deutschland, Jahre, Nationalität, Herkunfts-/Zielländer
-
Wanderungen zwischen Deutschland und dem Ausland:Deutschland, Jahre, Nationalität, Herkunfts-/Zielländer
-

Passagiere (Einsteiger) (Luftverkehr): Deutschland, Monate(bis 2010), Herkunftsflughafen, Zielland
-
Passagiere (Einsteiger) (Luftverkehr): Deutschland, Monate(bis 2010), Herkunftsflughafen, Zielland