 My GeoNetwork catalogue
Landsat-8
Provided by
Type of resources
Available actions
Topics
Keywords
Contact for the resource
Update frequencies
-
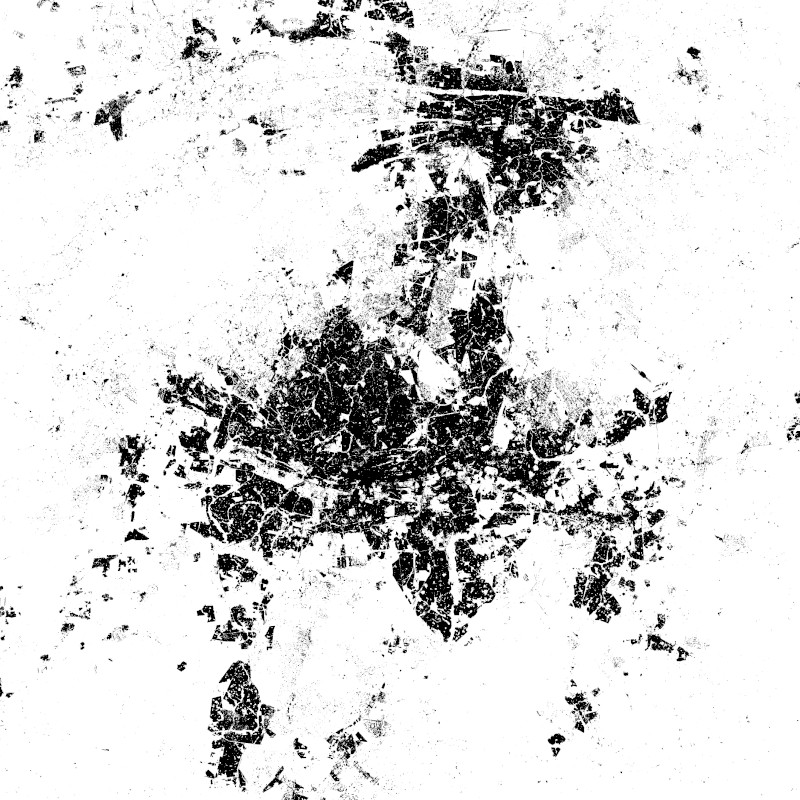
The World Settlement Footprint WSF 2015 version 2 (WSF2015 v2) is a 10m resolution binary mask outlining the extent of human settlements globally for the year 2015. Specifically, the WSF2015 v2 is a pilot product generated by combining multiple datasets, namely: • The WSF2015 v1 derived at 10m spatial resolution by means of 2014-2015 multitemporal Landsat-8 and Sentinel-1 imagery (of which ~217K and ~107K scenes have been processed, respectively); https://doi.org/10.1038/s41597-020-00580-5 • The High Resolution Settlement Layer (HRSL) generated by the Connectivity Lab team at Facebook through the employment of 2016 DigitalGlobe VHR satellite imagery and publicly released at 30m spatial resolution for 214 countries; https://arxiv.org/pdf/1712.05839.pdf • The novel WSF2019 v1 derived at 10m spatial resolution by means of 2019 multitemporal Sentinel-1 and Sentinel-2 imagery (of which ~ 1.2M and ~1.8M scenes have been processed, respectively); https://doi.org/10.1553/giscience2021_01_s33 The WSF2015 v1 demonstrated to be highly accurate, outperforming all similar existing global layers; however, the use of Landsat imagery prevented a proper detection of very small structures, mostly due to their reduced scale. Based on an extensive qualitative assessment, wherever available the HRSL layer shows instead a systematic underestimation of larger settlements, whereas it proves particularly effective in identifying smaller clusters of buildings down to single houses, thanks to the employment of 2016 VHR imagery. The WSF2015v v2 has been then generated by: i) merging the WSF2015 v1 and HRSL (after resampling to 10m resolution and disregarding the population density information attached); and ii) masking the outcome by means of the WSF2019 product, which exhibits even higher detail and accuracy, also thanks to the use of Sentinel-2 data and the proper employment of state-of-the-art ancillary datasets (which allowed, for instance, to effectively mask out all roads globally from motorways to residential).
-

This product is a vector file of the districts of the Paraguayan Chaco. It contains information on the forest cover within each district for the years 1986 until 2020. Hence, this product aggregates the information of 34 annual forest maps of the Paraguayan Chaco to a district level and provides the basis for further analysis as conducted in the following publication: https://doi.org/10.3390/f13010025
-
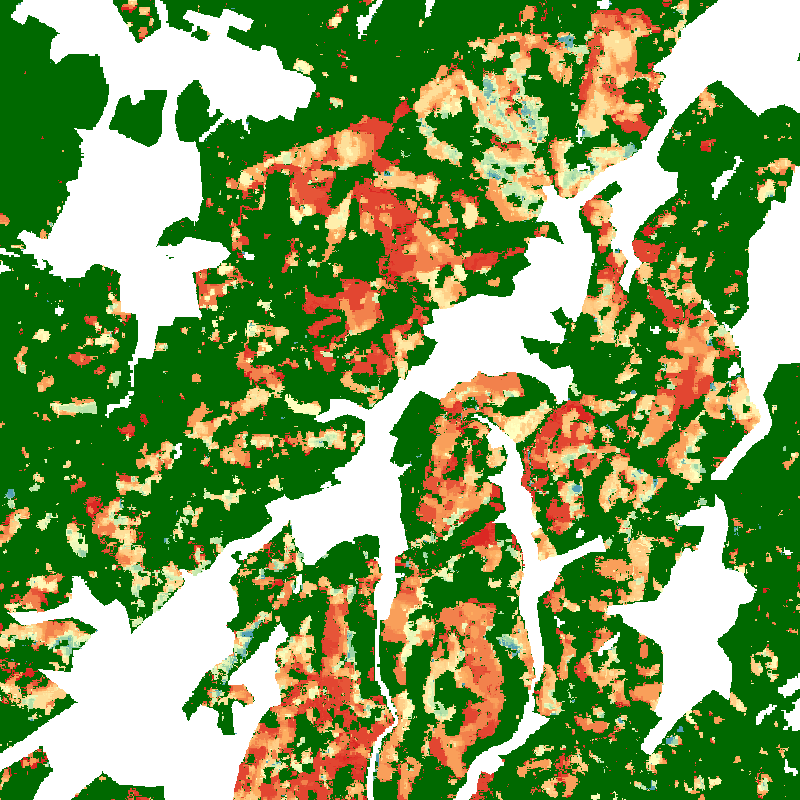
The product shows tree canopy cover loss in Germany between January 2018 and April 2021 at monthly temporal and 10 m spatial resolution. The basic principle behind this map is to compute monthly composites of the disturbance index (DI, Healey et al. 2005), a spectral index sensitive to forest disturbance, from all available Sentinel-2 and Landsat-8 data with less than 80 % cloud cover. These monthly composites are then compared to a median composite of the DI for 2017, which serves as a reference. After applying a threshold to the difference image, the time series of detected losses is checked for consistency. Only losses recorded continuously in all observations of a pixel until the end of the time series are considered. The dataset does not differentiate between the drivers of the losses. It depicts areas of natural disturbances (windthrow, fire, droughts, insect infestation) as well as sanitation and salvage logging, and regular forest harvest. The full description of the method and results can be found in Thonfeld et al. (2022).
-
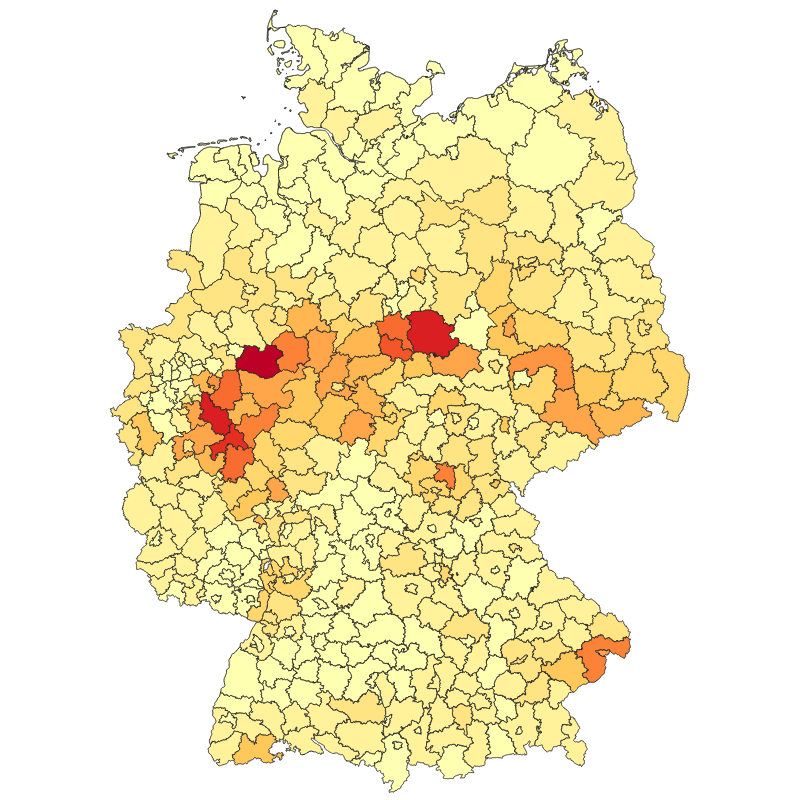
The product contains information of tree canopy cover loss in Germany per district (Landkreis) between January 2018 and April 2021 at monthly temporal resolution. The information is aggregated at from the 10 m spatial resolution Sentinel-2 and Landsat-based raster product (Tree Canopy Cover Loss Monthly - Landsat-8/Sentinel-2 - Germany, 2018-2021). The method used to derive this product as well as the mapping results are described in detail in Thonfeld et al. (2022). The map depicts areas of natural disturbances (windthrow, fire, droughts, insect infestation) as well as sanitation and salvage logging, and regular forest harvest without explicitly differentiating these drivers. The vector files contain information about tree canopy cover loss area per forest type (deciduous, coniferous, both) and per year (2018, 2019, 2020, January-April 2021, and January 2018-April 2021) in absolute numbers and in percentages. In addition, the vector files contain the district area and the total forest area per district.
-

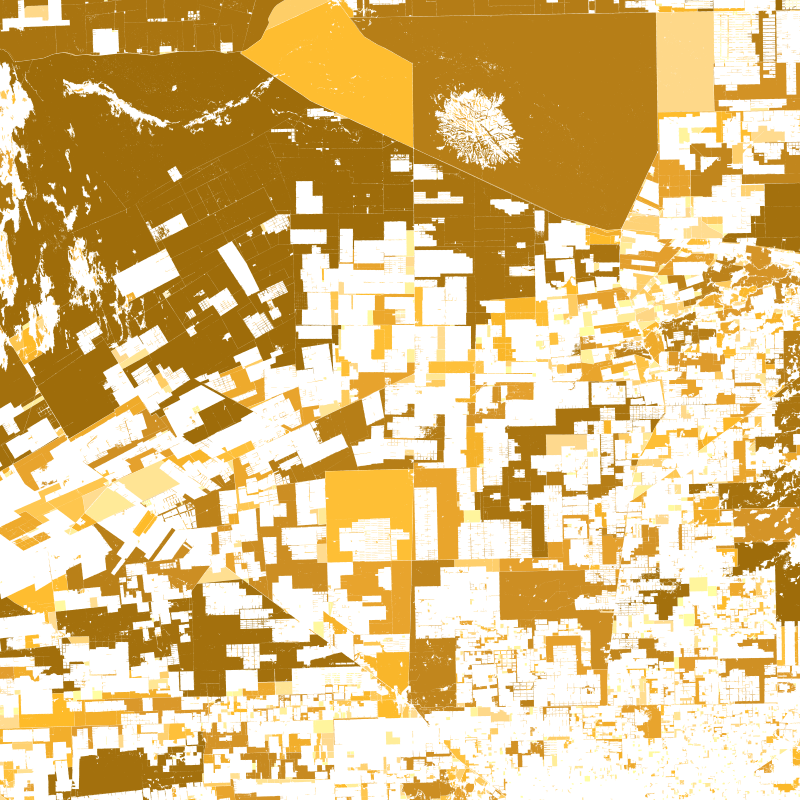
The dataset is based on the analysis of forest cover dynamics in the Paraguayan Chaco (northeastern part of Paraguay) between 1987 and 2020. The underlying forest masks were derived through annual forst classifications with a Random-Forest-Classifier trained on Landsat data from 1987 until 2020. The map shows the year in which the forest area was lost.
-
This product is a vector file of the protected areas of the Paraguayan Chaco. It contains information on the forest cover within each protected area and a 5, 10, and 15 km buffer zone around these areas, for the years 2000 until 2020. Hence, this product aggregates the information of 21 annual forest maps of the Paraguayan Chaco to the level of protected areas and provides the basis for further analysis as conducted in the following publication: https://doi.org/10.3390/f13010025
-
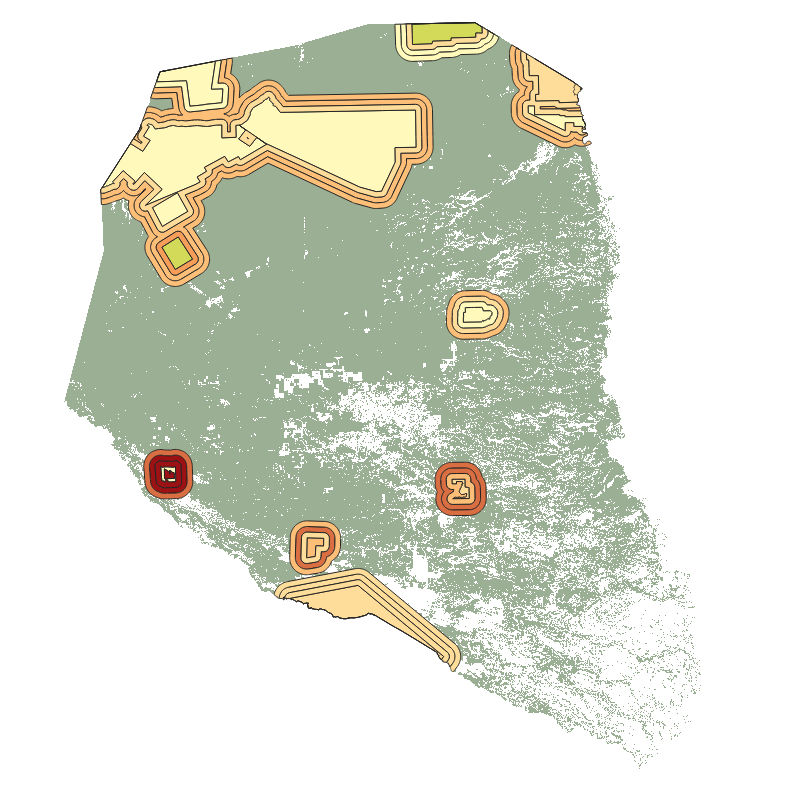
This product is a shape file of all detected forest patches in the Paraguayan Chaco that are larger than 10 hectars fort he years 2000, 2010, and 2020. Every forest patch contains information on its perimeter, size, shape, and core area. By looking at all forest patches together, an impression can be gained of the fragmentation of the forest in the Paraguayan Chaco. Proximity is a measure of fragmentation. Areas of large and close by forest patches show high proximity values while isolated patches or patchest hat are only surrounded by small forest patches, have a small proximity. The Core area index quantifies the share of core area in the entire forest patch area. Thereby, corea area is the area of a forest patch with at least 500m distance to the edge of the forest. The Shape index is calculated from perimeter and area of a patch. The fragementation of a forest often has the effect that the ratio between area and perimeter is affected. The edge lengths become longer while the surface area becomes smaller.