Keyword
SO2
90 record(s)
Provided by
Type of resources
Available actions
Topics
Keywords
Contact for the resource
Update frequencies
Service types
-

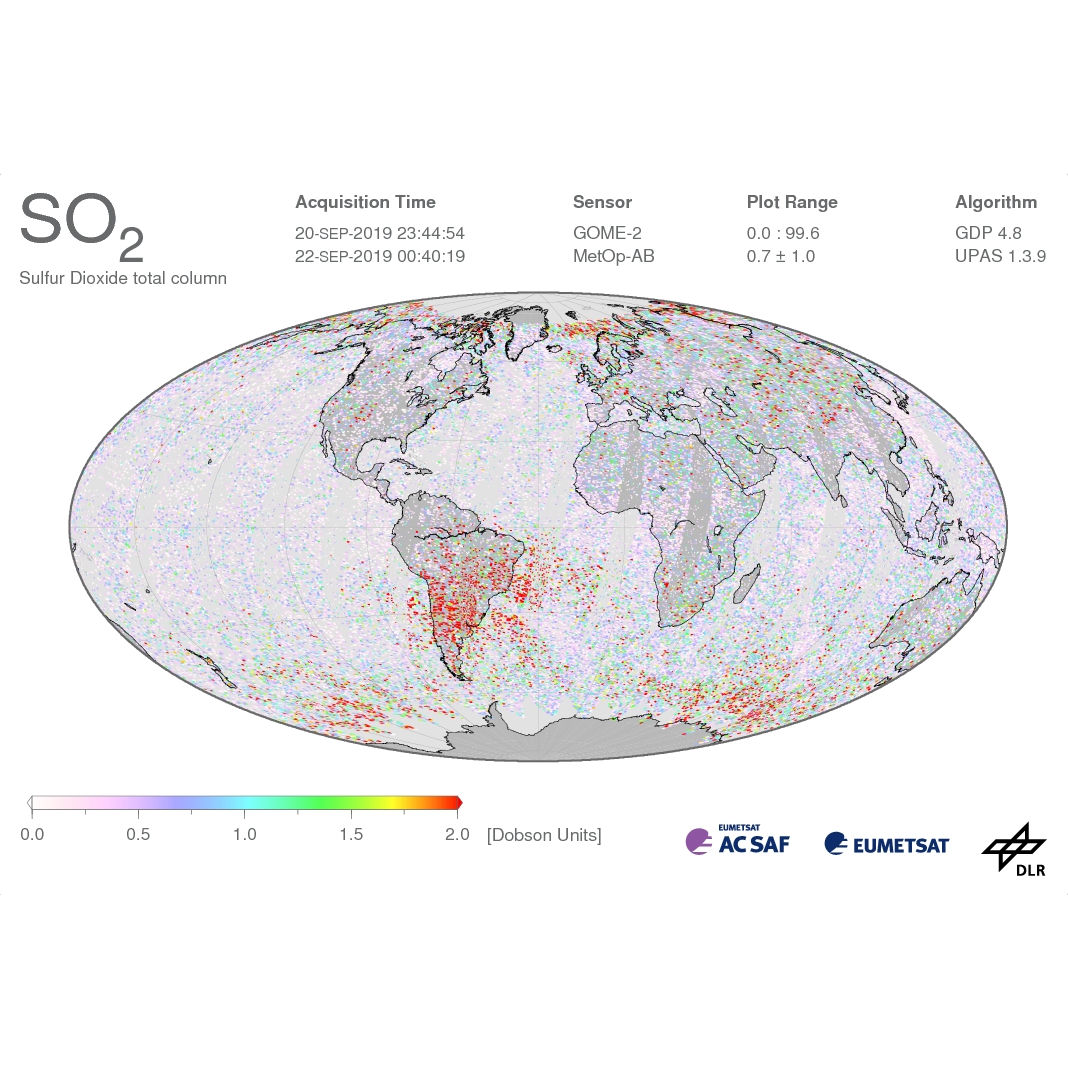
The Global Ozone Monitoring Experiment-2 (GOME-2) instrument continues the long-term monitoring of atmospheric trace gas constituents started with GOME / ERS-2 and SCIAMACHY / Envisat. Currently, there are three GOME-2 instruments operating on board EUMETSAT's Meteorological Operational satellites MetOp-A, -B, and -C, launched in October 2006, September 2012, and November 2018, respectively. GOME-2 can measure a range of atmospheric trace constituents, with the emphasis on global ozone distributions. Furthermore, cloud properties and intensities of ultraviolet radiation are retrieved. These data are crucial for monitoring the atmospheric composition and the detection of pollutants. DLR generates operational GOME-2 / MetOp level 2 products in the framework of EUMETSAT's Satellite Application Facility on Atmospheric Chemistry Monitoring (AC-SAF). GOME-2 near-real-time products are available already two hours after sensing. The operational SO2 total column products are generated using the algorithm GDP (GOME Data Processor) version 4.x integrated into the UPAS (Universal Processor for UV / VIS Atmospheric Spectrometers) processor for generating level 2 trace gas and cloud products. GDP 4.x performs a DOAS fit for SO2 slant column followed by an AMF / VCD computation using a single wavelength. Corrections are applied to the slant column for equatorial offset, interference of SO2 and SO2 absorption, and SZA dependence. For more details please refer to relevant peer-review papers listed on the GOME and GOME-2 documentation pages: https://atmos.eoc.dlr.de/app/docs/
-

OGC:WMS:Europäischer Luftqualitätsindex (basierend auf Schadstoffkonzentrationen in µg/m3): stündliche Messungen für den Schadstoff SO2 zur letzten Stunde für jede Station - Der Teilindex SO2 ist verfügbar je nach Art der Station (Industrie, Hintergrund oder Verkehr) und gemäß der Methodik zur Berechnung des europäischen Luftqualitätsindexes für die Messstationen in der gesamten Großregion. - Datentiefe: Der aktuellste Teilindex für die letzten 3 Stunden ist für jede Station stündlich verfügbar. Wenn die Berechnung des Indexes aufgrund fehlender Daten nicht möglich ist, wird ihr Wert durch einen grauen Punkt in der Kartensymbologie gekennzeichnet (Daten nicht verfügbar). - Datenquellen: ATMO Grand Est; Agence Wallonne de l'Air et du Climat - AWAC; Landesamt für Umwelt- und Arbeitsschutz Saarland - IMMESA; Landesamt für Umwelt Rheinland-Pfalz - ZIMEN; Administration de l'environnement Luxembourg. Harmonisierung: ATMO Grand Est und GIS-GR 2020
-
%20-%20Beurteilungsgebiete.png)
Datenstrom B umfasst alle Informationen zu den Beurteilungsgebieten – wie Name, Gebietscode, Abgrenzung, Einwohnerzahl, Historie, Schadstoffe und Schutzziele, Fristverlängerung.
-
Mit dem Datenstrom C wird stoffspezifisch die Einstufung aller Beurteilungsgebiete in Bezug auf die untere und obere Beurteilungsschwelle (für Ozon in Bezug auf die langfristigen Zielwerte) berichtet. Im Ergebnis dieser Beurteilung ergeben sich die Anforderungen an die zu verwendenden Beurteilungsmethoden – ortsfeste Messung, orientierende Messung, Modellierung, objektive Schätzung (Link zu Datenstrom D).
-
Datenstrom G bildet die formale gebietsbezogene Beurteilung der Luftqualität in Bezug auf Grenz- und Zielwerte ab, ggf. unter Berücksichtigung gewährter Fristverlängerung und bereinigt um Beiträge aus natürlichen Quellen und der Ausbringung von Streusand und –salz im Winterdienst.
-
Luftqualitätsdaten Datenstrom B mit allen verfügbaren Jahresdatensätzen.
-
Datenstrom D umfasst alle Informationen zu den Beurteilungsmethoden.
-
Datenstrom B umfasst alle Informationen zu den Beurteilungsgebieten – wie Name, Gebietscode, Abgrenzung, Einwohnerzahl, Historie, Schadstoffe und Schutzziele, Fristverlängerung.
-
Datenstrom D umfasst alle Informationen zu den Beurteilungsmethoden.
-

Mehrmals täglich ermitteln Fachleute an Messstationen der Bundesländer und des Umweltbundesamtes die Qualität unserer Luft. Schon kurz nach der Messung können Sie sich über die Luftdaten-API die aktuellen Messwerte abrufen. Zurzeit sind Daten ab dem Jahr 2016 abrufbar. Bitte beachten Sie, dass es sich bei den Daten des laufenden Jahres um noch nicht endgültig geprüfte Daten handelt. Erst im Juni des Folgejahres werden die finalen Daten bereitgestellt. Die aktuellen Daten können Lücken aufgrund Übertragungsproblemen enthalten. Das UBA kann keine Vollständigkeit garantieren. Unterjährig erfolgen Updates mit vorläufig geprüften Daten.
 www.geodatenkatalog.de (S1L)