 My GeoNetwork catalogue
geophysics
Provided by
Type of resources
Available actions
Topics
Keywords
Contact for the resource
Update frequencies
Service types
-
-
Two strong eruptions of Stromboli Volcano (38.789°N 15.213°E, 920 m) occurred on July 3rd and August 28th 2019. This data set provides the infrasound records in terms of raw pressure data in Pascal of both eruptions available at BGR’s infrasound array I26DE in Germany as well as infrasound arrays OHP and CEA in France. The publication “Using dense seismo-acoustic network to provide timely warning of the 2019 paroxysmal Stromboli eruptions” (Le Pichon et al., 2021, Scientific Reports) provides further details on this data set and its scientific application. Data format: The data are provided as ASCII files (separate file for each infrasound sensor and hour of measurement, plus a README file).
-
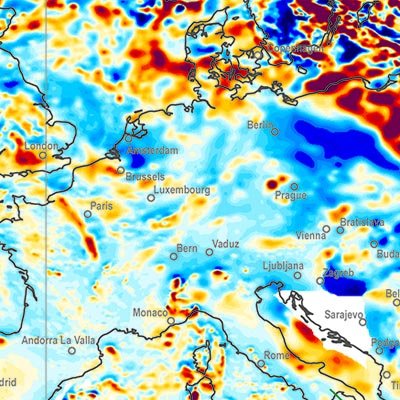
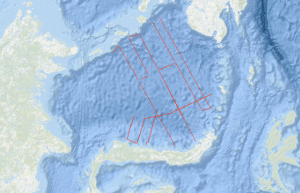
A global Earth Magnetic Anomaly Grid (EMAG2) was compiled from satellite, ship and airborne magnetic measurements. (Maus et al., 2009) Over the continents and the Arctic we made use of exisiting magnetic anomaly grids, whereas original ship and airborne trackline data were processed over the rest of the oceans, wherever available. CHAMP satellite magnetic measurements provided the magnetic field at wavelengths above 330 km. The EMAG2 grid is available at http://geomag.org and http://ngdc.noaa.gov. Directional gridding Due to the sparsity of magnetic field measurements in the southern oceans, it is necessary to interpolate the magnetic field between tracklines. Our interpolation algorithm takes the direction of the magnetic lineations into account. Tje lineations are parallel to the isochrons, which are perpendicular to the gradient of the age of teh oceanic crust. We use the age grid of Müller et al. (2008). The magnetic field ad a given grid point is computet by Least Squares Collocation from the surrounding measurements. If the point is on land, we use an isotropic correlation function with Rc = 14 km correlation length. Over the oceans we use Rc = 56 km parallel to the isochrons and Rc = 14 km in the spreading direction. Measurements seperated from the grid point by an age discontinuity or a topographic feature are excluded from the collation.
-
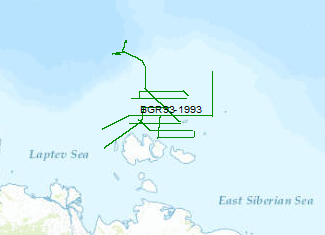
In September 1993, the Federal Institute for Geoscience and Natural Resources (BGR) has carried out in cooperation with Sevmorneftegeofizika (SMNG), Murmansk a 2D-seismic survey of the eastern part of the Laptev Sea shelf. The data format is Society of Exploration Geophysicists SEG Y. During the survey with a total length of 3189 km the 70 km wide New Siberian Basin and two other basins were mapped. In the central part of the New Siberian Basin, a Tertiary sediment thickness of more than 4 km overlying older sediments was observed. Further to the east, a large area covered by lava flows of unknown thickness was investigated. There are no indications of a propagation of real seafloor spreading into the Laptev Shelf and thus the Asian continental crust. Therefore seafloor spreading seems impossible at total spreading rates below 0.7 cm/year, at least for crust of the character which is present here.
-
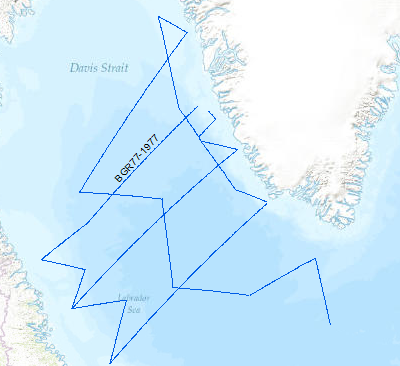
A geophysical reconnaissance survey was carried out in the Labrador Sea and Davis Strait between July and September 1977 by BGR. The data format is Society of Exploration Geophysicists SEG Y. The survey was executed on the research vessel MS Explora. The seismic, magnetic and gravity data from 5931 line-kilometers on 21 lines were recorded on magnetic tape. A 24-fold coverage technique was used with 48 seismic channels (traces), with a 2400m streamer cable, and 23.45 l airgun array. A full integrated computerized satellite navigation system (INDAS III) served as positioning system. Based on a preliminary interpretation of the seismograms, the Labrador Sea was devided into an eastern (Greenland) and western (Canadian) area, seperated by the Mid Labrador Ridge. Within the eastern part of the Labrador Sea the Pre-Cenozoic sediments show three distinct layers, traceable over the entire Greenland area of the sea. In the Cenozoic layer olisthostromes occur. The highest apparent velocity determined from sonobuoy data was 9.26 km/sec. The calculated refractor lies at a depth of approximately 13 km. The seismic section from the sediments on the Canadian side of the Labrador Sea show a uniform series of thick sediments below the Cenozoic cover. The highly disturbed basement is often masked by the multiple reflections from the seafloor. Statements about the nature and structure of the basement can only be made after processing data.
-
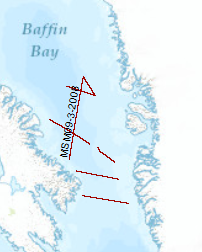
The cruise leg MSM09/3 was conducted as a cooperative project between the Alfred Wegener Institute for Polar and Marine Research (AWI), the Federal Institute for Geosciences and Resources (BGR), the Geological Survey of Denmark and Greenland (GEUS) and Dalhousie University. The data format is Society of Exploration Geophysicists SEG Y. A geophysical survey covered areas of Baffin Bay and Davis Strait between Greenland and the Canadian Baffin Island. A component of the IPY 2007/08 Lead Project Plate Tectonics and Polar Gateways in the Earth System (PLATES & GATES), this project DAVIS GATE is aimed to develop a tectonic and sedimentary reconstruction of the opening process of this oceanic gateway. Baffin Bay and Davis Strait play an important role in the shallow water exchange from the Arctic to the Atlantic Ocean. The plate-tectonic evolution as well as the magmatic history of this region has been sparsely known and required a careful geophysical investigation in order to construct a set of gridded detailed paleotopographic maps for a complete geodynamic reconstruction of this gateway. With a set of three seismic refraction/wide-angle reflection profiles, using ocean-bottom seismometers on 62 stations, as well as multi-channel reflection seismic recordings with a 3000-m long streamer, data were acquired from the sedimentary cover to the deep crust and even from parts of the uppermost mantle. Additional seismic data supplement these profiles and provide insights into the structures of the basement and dominant fault zones such as the Ungava fault system. A parallel running magnetic survey aimed to resolve the temporal evolution of the oceanic crust of Baffin Bay. The extension and subsidence of the continental and transitional crust in the Davis Strait and the evolution of oceanic crust in the Labrador Sea and Baffin Bay could be investigated with dataset to which continuously recorded gravity anomaly data and sub-bottom profiler data also contribute. This dataset provides the basis of geometrical and physical properties of the crust required for a realistic geodynamic model which will describe the break-up and the ocean basin evolution between Greenland and Canada in terms of detailed paleo-topography.
-
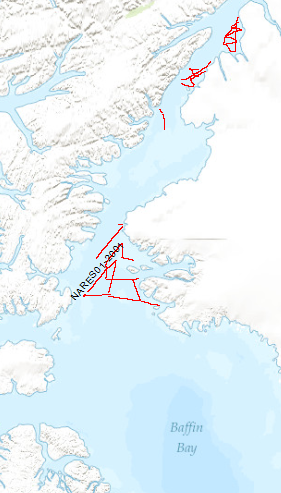
The Scientific staff and crew onboard CCGS Louis S. St. Laurent (LSL) returned September the 10th, 2001 from a scientific expedition to the Nares Strait, the northernmost waterway connecting the Arctic and Atlantic oceans. The data format is Society of Exploration Geophysicists SEG Y. The ice conditions in the strait required the support of Canada's largest ice breaker. The ship was a versatile platform for 34 scientists to accomplish their marine investigation. The LSL has a history of supporting international scientific expeditions including an oceanographic transect of the Arctic Ocean in 1994 and a biological study of the Canadian Arctic Islands in 1999. Germany (Bundesanstalt für Geowissenschaften und Rohstoffe, BGR) and Canada (Geological Survey of Canada) undertook a 5-week scientific cruise to study and explore the geological structure and evolution of the Nares Strait. The primary objective was the study of structural features relating to the formation of the Arctic Ocean and, in particular, the study of the Wegener Fault. This fault is a linear boundary between Greenland and Ellesmere Island which was noted by the German scientist Alfred Wegener in 1915 and later became the subject of a major scientific controversy. The co-operative cruise, which was planned over a period of 2 years, provided the basis for a wide range of scientific investigations, from marine seismic work and climate change studies through airborne magnetic investigations to geodetic survey measurements and geological sampling onshore. Systematic geophysical offshore studies in this key area had not been undertaken before. Where towing of seismic equipment was not possible because of ice coverage, magnetic maps were made using a helicopter-borne magnetic sensor system. Sediment and water samples taken during the cruise provide information on changes in climate and sea ice cover from the last ice-age to the present. An 11 m-long sediment core from outer Jones Sound is the longest core ever taken in the Canadian Arctic channels and holds clues to the detailed climate history of northern Baffin Bay.
-
Main target of the project GIGICS (Cooperative German-Indonesian Geoscientific Investigations in the Celebes Sea) is the investigation of the internal crustal structure and the plate tectonic evolution of the Celebes Sea and its active continental margins off Mindanao and Northern Sulawesi. These investigations were carried out during the cruise SO98 of RV SONNE by the Federal Institute for Geosciences and Natural Resources (BGR), Hannover; the German Research Centre for Geosciences (GFZ), Potsdam; the GEOMAR, Kiel; the Institute of Oceanography (IfM), Hamburg; the Mines and Geoscience Bureau, Manila; the Agency for the Assessment and Application of Technology, Jakarta, and the Institute of Oceanography, Wormley. The cruise SO98 consisted of three legs of two weeks duration and one leg of four weeks duration. The total amount of data acquired during the cruise were: - 3,300 km of multichannel reflection seismics, - over 6,800 km of gravimetric and magnetic data and approximately 10.000 km of swath bathymetric and sediment echosounder data, - 3 wideangle-/refractionseismic profiles, each of 120 - 150 km length, - geological, geochemical sampling and oceanographical measurements at a total of 37 stations. During the cruise SO98 a widespaced but regular grid of magnetic and gravimetric profiles were acquired in the eastern part of the Celebes Sea from which up to then reliable data were very sparse. WEISSEL (1980) recognized in the western Celebes Sea WSW-ENE striking magnetic lineations, which he interpreted as chrons 18 - 20 (39 - 43 Ma according to the timescale of HARLAND et al. (1990)). The data from cruise SO98 show that there is no continuation of these anomalies to the east. In the eastern part the magnetic field of the Celebes Sea is less clear and much more disturbed. Nevertheless, E-W-striking anomalies are recognizable. Because amplitudes of local magnetic anomalies are higher than the lineations, the correlation of these lineations with the magnetic reversal scale is still somewhat ambiguous. The gravity map compiled from the measured gravimetric data shows elongated positive anomalies in the eastern part of the Celebes Sea. Exceptions occur at the deep sea trenches off North Sulawesi (North Sulawesi Trench) and Mindanao (Cotabatu Trench) and at the Sulu Archipelago where strong negative gravity anomalies were found. A remarkable NW-striking gravity high of up to 60 mgal was found in the central eastern part of the Celebes Sea. Gravimetric modelling suggests that this high can be correlated with the gravimetric effect of the Molucca Sea Plate subducting from the east under the Sangihe Arc. The reflection seismic data from the northern part of the Celebes Sea show indications for a juvenile subduction of oceanic Celebes Sea crust under the Sulu Archipelago. The oceanic crust bends down towards the Sulu Arc with angles between 2° and 5° and the sedimentary sequence above is deformed indicating a compressional stress regime. With the exception of two linear arranged seamount-like basement highs the Celebes Sea is dominated by two different oceanic crustal types showing distinct differences in the topography. The first one is showing a very similar reflection seismic pattern as it is found for oceanic crust of the Atlantic (HINZ et al., 1994). This type is characterized by a small-scale block-faulted relief of the top basement and a low reflectivity in lower crustal levels typically related as to be accreted at slow to intermediate spreading ridges. This type is found in the western, northern and southern part of the investigated area. In the eastern and especially in the southeastern part the igneous crust shows a very different image. The reflection of the top of the basement is less distinct and of lower frequency. The relief is very much smoother than in the previous type. This reflection seismic image indicates a volcanic/magmatic overprinting of the oceanic crust in this part of the Celebes Sea. Another target of cruise SO98 was the area of the active continental margin off North Sulawesi and its accretionary complex. The internal structure of the accretionary complex should be investigated to decide whether this active margin is also of the 'splinter-type' or not. During former geophysical cruises with RV SONNE oceanic crustal splinters were discovered in the accretionary wedges of the Sulu Sea and off Costa Rica (e.g. HINZ et al., 1991). From our reflection seismic measurements this active continental margin is morphologically subdivided into three units and consists of two accretionary complexes of different internal structural style: the lower and middle continental slope is underlain by an intensively thrusted, sedimentary accretionary wedge. This wedge was most probably formed during the last 5 Ma. Landward of this wedge an older and seismically very complex accretionary unit is present which is overlain at its landward termination by a sedimentary fore-arc basin. Within this older accretionary complex, units with a strong, low frequency reflection pattern were found which are interpreted to represent crustal splinters of igneous oceanic or ophiolitic nature. This interpretation is supported by our gravity and magnetic data. The magnetic profiles show an increase of the magnetic field towards the north arm of Sulawesi across the continental margin. This increase of the magnetic field suggests an increase of magnetized material within the older accretionary wedge towards the northern arm of Sulawesi where ophiolites are emplaced. During the interpretation of the reflection seismic data of the project GIGICS BSR's (bottom simulating reflectors) were discovered for the first time along the active continental margin of North-Sulawesi. BSR's are the seismic expression of a velocity decrease at the bottom of a gas hydrate zone. The distribution and depth of the BSR's correlates with the geochemical and geothermal results. Radiometric age dating and geochemical analyses from pillow basalts of a seamount from the southeastern Celebes Sea indicate hot-spot activity in this part of the Celebes Sea during or shortly after the formation of the oceanic crust approximately at 43 Ma ago. Three NW-striking ridges or seamount-chains in the northeastern Celebes Sea were mapped and investigated in detail. They are thought to represent a wrench fault system extending through the northeastern Celebes Sea. At the flank of one of these ridges a strongly alterated plagioclase-olivine basalt sample was dredged which was overlain by non-fossiliferous clay stone. A similar lithostratigraphic sequence was drilled during ODP leg 124 (RANGIN et al., 1990). The geochemical composition of these basalts is different from typical MORB. The existence of a large crustal splinter within the accretionary wedge off southwestern Mindanao obviously is responsible for a high thermal conductivity which in turn could have enhanced heat flow (108.1 mW/m2) and methanogenesis (405 ppb). The heat flow of 103.0 mW/m2 at the deformation front of the Mindanao wedge and the high methane concentration of 5.555 ppb suggests tectonically induced fluid transport within the wedge. High methane concentrations between 8.044 and 49.006 ppb at the lower slope off Sulawesi and in the North Sulawesi Trench are accompanied by high heat flow values of up to 100.5 mW/m2. Heat flow is significantly lower upslope (31.3 mW/m2). This general heat flow distribution pattern is seen over a large portion of the accretionary wedge. The elevated heat flow values and high methane concentrations near the deformation front most likely result from heat transport by fluids squeezed out from vertically and laterally compacting sediments. The reduced heat flow towards the coast is compatible either with a cooling effect of slow subduction of the oceanic crust, or stacking of cool slabs of compacted sediments. A subduction of oceanic crust with a heat flow around 60 mW/m2 over a period of more than 3 million years would have produced the low heat flow values of the upper slope if the wedge consists of claystone with a low thermal conductivity (1.2 - 1.7 W/mK). Even in the low-heat flow area isolated fluid venting is possible. Lateral variations in the heat flow pattern (e.g. broadening of the anomalies in the west) may be due to different thermal regimes within the subducted crust.
-
This dataset consists of data products derived from broadband signal detection lists that have been processed for the certified infrasound stations of the International Monitoring System. More specifically, this dataset, called the ‘maw’ product, covers a very low frequency range of infrasound (0.02-0.07 Hz). The temporal resolution (time step and window length) is 30 min. For processing the infrasound data, the Progressive Multi-Channel Correlation (PMCC) array processing algorithm with a one-third octave frequency band configuration between 0.01 and 4 Hz has been used. The detected signals from the most dominant directions in terms of number of arrivals within a time window and the product-specific frequency range are summarized at predefined time steps. Along with several detection parameters such as the back azimuth, apparent velocity, or mean frequency, additional quantities for assessing the relative quality of the detection parameters are provided. The dataset is available as a compressed .zip file containing the yearly data products (.nc files, NetCDF format) of all certified stations (since 2003). Further information on the processing and details about the open-access data products can be found in: Hupe et al. (2022), IMS infrasound data products for atmospheric studies and civilian applications, Earth System Science Data, doi:10.5194/essd-14-4201-2022.
-
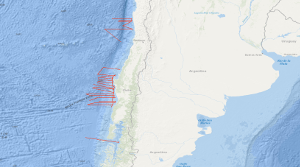
Within the frame of the comprehensive SPOC project (Subduction Processes off Chile) the SONNE cruises SO161 Leg 2 and 3 have been conducted between October 16th and November 29th, 2001, off central Chile between 28° and 44° S. In that period some 5,300 km were surveyed with multichannel seismic (MCS) reflection, magnetic, gravity, high-resolution bathymetric and echographic methods. In addition, approximately 3,900 km were surveyed with the same spectrum of methods but without MCS. The total number of 2D profiles was 48. Target was the variation of the subduction properties between the convergent oceanic Nazca and continental Southamerica plates and the different conditions that might influence the subduction process as there are: (1) age of the oceanic crust, (2) its structure and composition, (3) its sedimentary cover, (4) its thermal state, (5) the subduction angle and obliquity, and (6) the terrigenous sediment afflux from the continent. Furthermore, special focus was given to the subduction front, the subduction interface, the structure of the slope as well as to the forearc basin structure and history, and the general distribution of gas hydrate indicating bottom simulating reflectors (BSR's). The results are to be compared with previous studies of the Chilean active margin, e.g. CONDOR (SO 101 and 103) and CINCA (SO 104). The SPOC target area was subdivided into three sub-areas A,B and C. One area was chosen for a detailed survey by aid of a narrowly spaced grid and for a close link with a lot of partners. This area is characterized by a distinctly different margin type south of it is assumed. Moreover, the subducting portion of the aseismic Juan Fernandez Ridge is located in that area representing another important target of the survey. Advantageous conditions enabled the survey of an east-west profile south of Chiloé Island, providing a section through the submerged coastal Cordillera into the flooded longitudinal valley. Some results of Leg 2 and 3 are: In all areas A, B and C no subduction bulge (outer high) in the oceanic crust was visible perhaps due to the shortness of the profiles. The sedimentary cover of the oceanic crust is exceptionally thin, and the crustal thickness is generally quite "normal" with around 7 km derived from relatively weak Moho reflections. In area B a so far magnetically unmapped region was filled providing reliable ages of the oceanic crust, and suggesting that the Challenger Fracture Zone abruptly terminates west of the area of investigation. The survey in area C yielded valuable information on the trench morphology. The so far unique MCS profile south of Chiloé island shows a very wide trench and allows to extrapolate the general conditions encountered an area A southward to approximately 44° S. It can be stated that the situation is in sharp contrast to the basin structures detected by industry profiles further north in the Golfo de Corcovado.