 My GeoNetwork catalogue
NO2
Provided by
Type of resources
Available actions
Topics
Keywords
Contact for the resource
Update frequencies
Service types
-
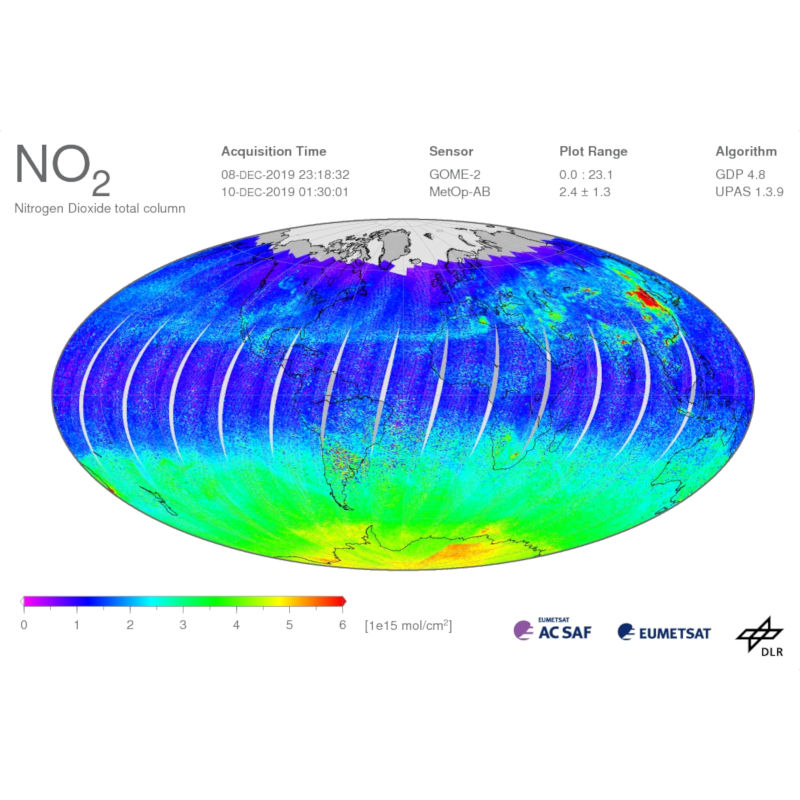
The Global Ozone Monitoring Experiment-2 (GOME-2) instrument continues the long-term monitoring of atmospheric trace gas constituents started with GOME / ERS-2 and SCIAMACHY / Envisat. Currently, there are three GOME-2 instruments operating on board EUMETSAT's Meteorological Operational satellites MetOp-A, -B, and -C, launched in October 2006, September 2012, and November 2018, respectively. GOME-2 can measure a range of atmospheric trace constituents, with the emphasis on global ozone distributions. Furthermore, cloud properties and intensities of ultraviolet radiation are retrieved. These data are crucial for monitoring the atmospheric composition and the detection of pollutants. DLR generates operational GOME-2 / MetOp level 2 products in the framework of EUMETSAT's Satellite Application Facility on Atmospheric Chemistry Monitoring (AC-SAF). GOME-2 near-real-time products are available already two hours after sensing. The operational NO2 total column products are generated using the algorithm GDP (GOME Data Processor) version 4.x integrated into the UPAS (Universal Processor for UV / VIS Atmospheric Spectrometers) processor for generating level 2 trace gas and cloud products. The total NO2 column is retrieved from GOME solar back-scattered measurements in the visible wavelength region (425-450 nm), using the Differential Optical Absorption Spectroscopy (DOAS) method. For more details please refer to relevant peer-review papers listed on the GOME and GOME-2 documentation pages: https://atmos.eoc.dlr.de/app/docs/
-
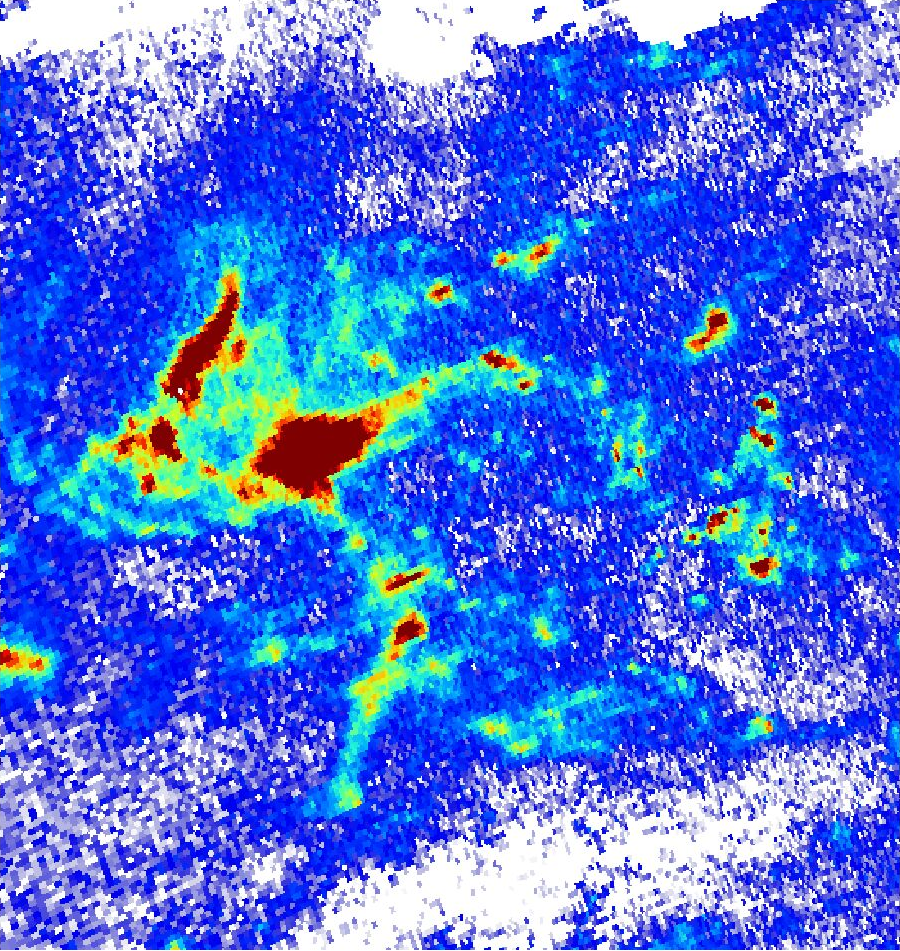
This collection contains tropospheric NO2 columns for Germany and surrounding areas derived from Sentinel-5P/TROPOMI Level-1B data. The Sentinel-5P tropospheric NO2 data is generated by DLR and provided in the framework of the mFUND-Project "S-VELD". The tropospheric NO2 data are vertical column densities with the unit "µmol/m2". Sentinel-5P observes Germany once per day at ~12:00 UTC. These daily observations are gridded onto a regular UTM grid. The day and measurement time are included in the netCDF data file. Only tropospheric NO2 data for cloud-free Sentinel-5P measurements are provided (cloud fraction < ~0.2). Sentinel-5P cloud fraction data is included in this collection as well.
-

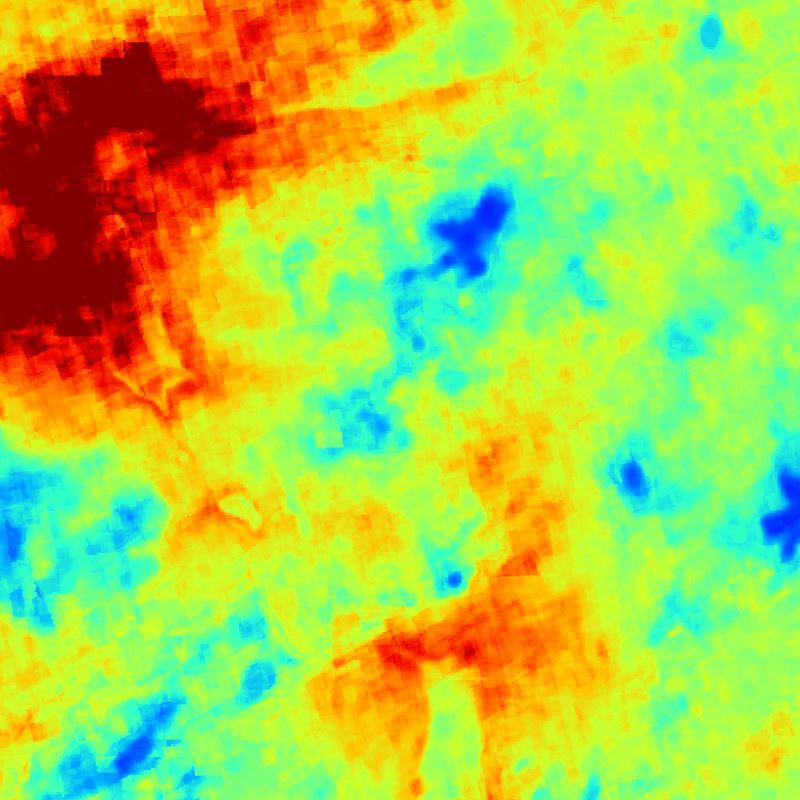
This collection contains monthly mean tropospheric NO2 columns for Germany and surrounding areas derived from Sentinel-5P/TROPOMI Level-1B data. The Sentinel-5P tropospheric NO2 data is generated by DLR and provided in the framework of the mFUND-Project "S-VELD". The tropospheric NO2 data are vertical column densities with the unit "μmol/m2". Sentinel-5P observes Germany once per day at ~12:00 UTC and only cloud-free measurements (cloud fraction < ~0.2) are used. The Sentinel-5P tropospheric NO2 data within each month are averaged and gridded onto a regular UTM grid. The number of measurements used in the calculation of the averaged value are included in this collection as well.
-
This collection contains monthly mean surface NO2 concentrations for Germany derived from Sentinel-5P/TROPOMI data. The Sentinel-5P NO2 data is generated by DLR and provided in the framework of the mFUND-Project "S-VELD". The surface NO2 data are concentrations with the unit "μg/m3". Sentinel-5P observes Germany once per day at ~12:00 UTC and only cloud-free measurements (cloud fraction less than ~0.2) are used. The Sentinel-5P surface NO2 data within each month are averaged and gridded onto a regular UTM grid. The number of measurements used in the calculation of the averaged value are included in this collection as well.
-
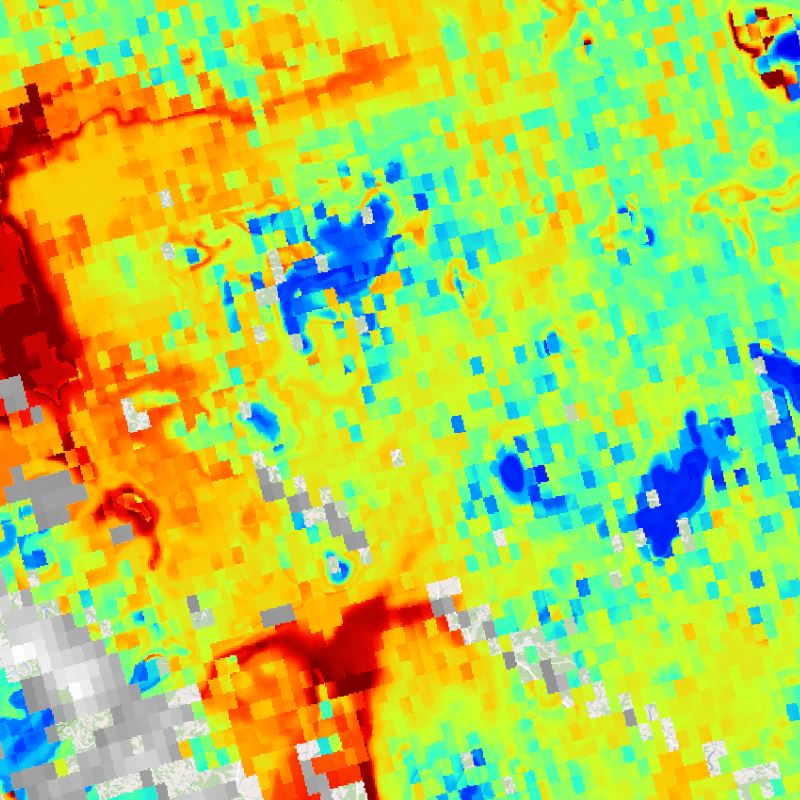
This collection contains surface NO2 concentrations for Germany derived from Sentinel-5P/TROPOMI data. The Sentinel-5P NO2 data is generated by DLR and provided in the framework of the mFUND-Project "S-VELD". The surface NO2 data are concentrations with the unit "µg/m3". Sentinel-5P observes Germany once per day at ~12:00 UTC. These daily observations are gridded onto a regular UTM grid. The day and measurement time are included in the netCDF data file. Only surface NO2 data for cloud-free Sentinel-5P measurements are provided (cloud fraction less than ~0.2). Sentinel-5P cloud fraction data is included in this collection as well.
-

OGC:WMS:Europäischer Luftqualitätsindex (basierend auf Schadstoffkonzentrationen in µg/m3): stündliche Messungen für den Schadstoff NO2 zur letzten Stunde für jede Station - Der Teilindex NO2 ist verfügbar je nach Art der Station (Industrie, Hintergrund oder Verkehr) und gemäß der Methodik zur Berechnung des europäischen Luftqualitätsindexes für die Messstationen in der gesamten Großregion. - Datentiefe: Der aktuellste Teilindex für die letzten 3 Stunden ist für jede Station stündlich verfügbar. Wenn die Berechnung des Indexes aufgrund fehlender Daten nicht möglich ist, wird ihr Wert durch einen grauen Punkt in der Kartensymbologie gekennzeichnet (Daten nicht verfügbar). - Datenquellen: ATMO Grand Est; Agence Wallonne de l'Air et du Climat - AWAC; Landesamt für Umwelt- und Arbeitsschutz Saarland - IMMESA; Landesamt für Umwelt Rheinland-Pfalz - ZIMEN; Administration de l'environnement Luxembourg. Harmonisierung: ATMO Grand Est und GIS-GR 2020
-
Als Umweltzone wird das Gebiet innerhalb des S-Bahn-Ringes bezeichnet, in dem nur Fahrzeuge fahren dürfen, die bestimmte Abgasstandards einhalten. Die Umweltzone gilt ab 1. Januar 2008.
-

Karten der Luftbelastung; seit 2000 Kartographische Darstellung der flächenhaften Immissionsbelastung in Deutschland durch Kombination von Messung und Modellrechnung
-
Als Umweltzone wird das Gebiet innerhalb des S-Bahn-Ringes bezeichnet, in dem nur Fahrzeuge fahren dürfen, die bestimmte Abgasstandards einhalten. Die Umweltzone gilt ab 1. Januar 2008.
-
Als Umweltzone wird das Gebiet innerhalb des S-Bahn-Ringes bezeichnet, in dem nur Fahrzeuge fahren dürfen, die bestimmte Abgasstandards einhalten. Die Umweltzone gilt ab 1. Januar 2008.