 www.geodatenkatalog.de (S1F)
Contact for the resource
Bundesanstalt für Geowissenschaften und Rohstoffe (BGR)
1029 record(s)
Provided by
Type of resources
Available actions
Topics
Keywords
Contact for the resource
Update frequencies
Service types
-
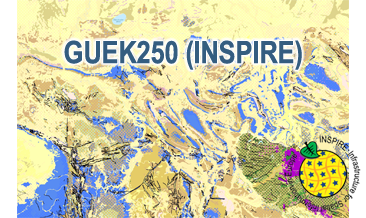
The WMS GÜK250 (INSPIRE) represents the surface geology of Germany on a scale of 1:250,000. In general, the term “surface geology” refers to geologic formations up to a depth of two meters. However, particularly in the south of Germany, considerable deviations of this concept exist and thicknesses of a couple of hundred meters may be displayed. According to the Data Specification on Geology (D2.8.II.4_v3.0) the geological map provides INSPIRE-compliant data. The GÜK250 (INSPIRE) contains a base layer and an overlay layer which usually represents thin Quaternary deposits. The WMS GÜK250 (INSPIRE) contains correspondingly two layers for the geologic units (GE.GeologicUnit.BaseLayer and GE.GeologicUnit.OverlayLayer). Additionally the WMS comprises layers representing the faults (GE.GeologicFault), marginal position of the ice shield (GE. NaturalGeomorphologicFeature) and quartz veins (GE.GeologicUnit.QuartzVein). The layers are mostly displayed according to the INSPIRE portrayal rules. The geologic units are represented graphically by stratigraphy (GE.GeologicUnit.BaseLayer.AgeOfRocks and GE.GeologicUnit.OverlayLayer.AgeOfRocks, stored in group layer GE.AgeOfRocks) and lithology (GE.GeologicUnit.BaseLayer.Lithology and GE.GeologicUnit.OverlayLayer.Lithology, stored in group layer GE.Lithology). Because INSPIRE doesn’t provide portrayal rules for the genesis (event process und event environment), this display mode is not available compared to the original WMS GÜK250. In case of different geochronologic minimum and maximum ages, e.g. Pleistocene - Holocene, the portrayal is defined by the colour of the geochronologic minimum age (olderNamedAge). The portrayal of the lithology is defined by the rock or rock group representing the main part of the petrographic composition of the geologic unit. For the portrayal of different petrographic main components the corresponding colours are superimposed in a dot pattern. Analogous to the original WMS GÜK250 the petrographic content is represented graphically according to the generic terms of the main components, e.g. clastic sedimentary rock, pure carbonate sedimentary rock or metamorphic rock. In case of the geologic units the user obtains detailed information on the stratigraphy, lithology and genesis via the getFeatureInfo request.
-
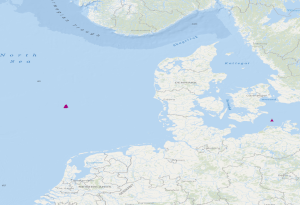
The dataset includes the locations of OBS stations (Ocean Bottom Seismometers) operated in the German Bight during cruise MSM100 with R.V. Maria S. Merian. The time interval from 13.05.2021 to 15.05.2021 has been analysed in a phase without airgun operation for passive recording with 4.5 Hz geophones. Furthermore, the dataset contains locations of 3 broadband OBS systems which were operated during an experiment at the Darss ramp in the German Baltic Sea. The records were analysed in the time interval 23.01.2018 to 01.04.2018.
-
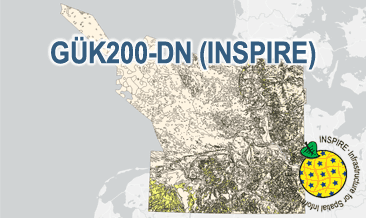
The General Geological Map of the Federal Republic of Germany 1:200,000 (GÜK200) provides detailed information on the stratigraphy, petrography and genesis of the geological units shown. In this revised GÜK200-DN, the onshore surface geology is shown in up to two overlays. The thin overlying soil is not shown. In the marine environment, only the petrography of the recent seabed is shown, which comprises the uppermost 20 cm of the seabed. In accordance with the original GÜK200 map sheets, the seabed is referred to stratigraphically as the recent seabed. According to the Data Specification on Geology (D2.8.II.4_v3.0) the geological map provides INSPIRE-compliant data. A base layer and two overlay layers are displayed correspondingly to the INSPIRE portrayal rules. The geologic units are represented graphically by stratigraphy (GE.GeologicUnit.BaseLayer.AgeOfRocks, GE.GeologicUnit.OverlayLayer1.AgeOfRocks, and GE.GeologicUnit.OverlayLayer2.AgeOfRocks) and lithology (GE.GeologicUnit.BaseLayer.Lithology, GE.GeologicUnit.OverlayLayer1.Lithology, and GE.GeologicUnit.OverlayLayer2.Lithology). The user obtains detailed information via the getFeatureInfo request on the lithology, stratigraphy (age) and genesis (event environment and event process).
-
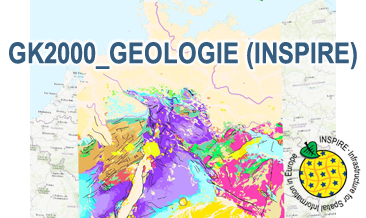
The WMS GK2000 Geologie (INSPIRE) represents the surface geology of Germany and adjacent areas on a scale of 1:2,000,000. According to the Data Specification on Geology (D2.8.II.4_v3.0) the geological map provides INSPIRE-compliant data. The WMS GK2000 Geologie (INSPIRE) contains layers of the geologic units (GE.GeologicUnit), faults (GE.GeologicFault) and marginal position of the ice shield as well as the impact craters Nördlinger Ries and Steinheimer Becken (GE. GeomorphologicFeature) displayed correspondingly to the INSPIRE portrayal rules. The geologic units are represented graphically by stratigraphy (GE.GeologicUnit.AgeOfRocks) and lithology (GE.GeologicUnit.Lithology). For different geochronologic minimum and maximum ages, Upper Devonian - Permian, the portrayal is defined by the colour of the geochronologic minimum age (olderNamedAge). In case of the geologic units the user obtains detailed information via the getFeatureInfo request on the lithology, stratigraphy (age) and genesis (event environment and event process).
-
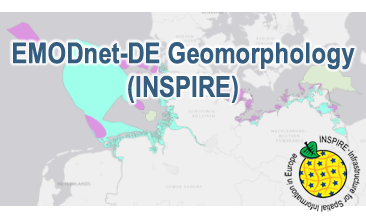
Compilation of the European marine geomorphology (section of Germany). According to the Data Specification on Geology (D2.8.II.4_v3.0) the geological map provides INSPIRE-compliant data. The WMS EMODnet-DE Geomorphology (INSPIRE) contains layers of the natural geomorphologic features (GE.GeomorphologicFeature) displayed correspondingly to the INSPIRE portrayal rules. Via the getFeatureInfo request the user obtains detailed information on the natural geomorphologic features.
-
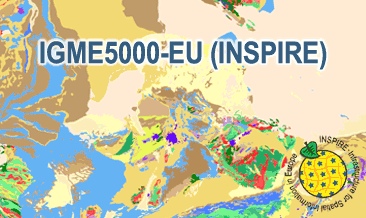
The IGME5000-EU (INSPIRE) represents the pre-quaternary bedrock geology (onshore and offshore) of the European map on a scale of 1:5,000,000. According to the Data Specification on Geology (D2.8.II.4_v3.0) the geological map provides INSPIRE-compliant data. The WMS IGME5000-EU contains layers of the geologic units (GE.GeologicUnit) and faults (GE.GeologicFault) mostly displayed according to the INSPIRE portrayal rules. The geologic units are represented graphically by stratigraphy (GE.GeologicUnit.AgeOfRocks) and lithology (GE.GeologicUnit.Lithology). For different geochronologic minimum and maximum ages, e.g. Ordovician - Silurian, the portrayal is defined by the color of the geochronologic minimum age (olderNamedAge). The portrayal of the lithology is defined by the first named rock or rock group. In case of the geologic units the user obtains detailed information via the getFeatureInfo request on the lithology and stratigraphy (age).
-
The dataset includes the locations of OBS stations (Ocean Bottom Seismometers) operated in the German Bight during cruise MSM100 with R.V. Maria S. Merian. The time interval from 13.05.2021 to 15.05.2021 has been analysed in a phase without airgun operation for passive recording with 4.5 Hz geophones. Furthermore, the dataset contains locations of 3 broadband OBS systems which were operated during an experiment at the Darss ramp in the German Baltic Sea. The records were analysed in the time interval 23.01.2018 to 01.04.2018.
-
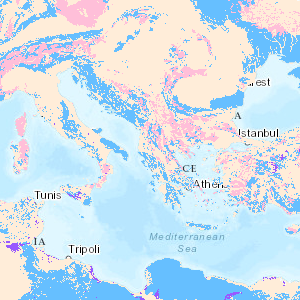
Karst aquifers constitute important freshwater resources, but are challenging to manage and to protect, because of their unique hydraulic structure and behaviour, representing continuous challenges for research and development. Karst aquifers are widespread and contribute to freshwater supply of most Mediterranean countries and many cities are supplied by karst water, e.g., Rome, Vienna, Montpellier and Beirut. These land surfaces correspond to the main recharge zones of karst aquifers, which are often hydraulically connected over large areas and are highly vulnerable to contamination. The preparation of the Mediterranean Karst Aquifer Map (MEDKAM) generally followed the workflow used for the World Karst Aquifer Map (WOKAM). A new lithological classification has been developed for the MEDKAM, similar to that of the WOKAM, which groups the geological units into four meaningful hydrogeological units: 1). Karst aquifers in sedimentary and metamorphic carbonate rocks. 2). Karst aquifers in evaporite rocks. 3). Various hydrogeological settings in other sedimentary and volcanic formations (karst aquifers are possibly present at depth). 4). Local, poor and shallow aquifers in other metamorphic rocks and igneous rocks (no karst aquifers present at depth).
-
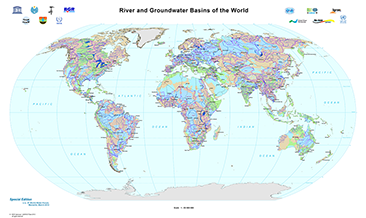
The World-wide Hydrogeological Mapping and Assessment Programme (WHYMAP) provides data and information about the earth´s major groundwater resources. The River and Groundwater Basins Map shows the areal extent of the global groundwater and surface water basins.
-
.png)
The WMS D-AERO (INSPIRE) comprises airborne geophysical surveys for mapping the shallow subsurface in Germany. Since the eighties BGR carries out helicopter borne measurements in Germany as well as in neighbouring and distant countries. In particular a series of continuous areas on the German North Sea coast are flown during the last years within the context of the D-AERO project. The helicopter of type Sikorsky S-76B is operated for the airborne geophysical survey of the earth's subsurface. Usually airborne electromagnetic, magnetic and radiometric measurements are carried out. According to the Data Specification on Geology (D2.8.II.4_v3.0, sub-theme Geophysics) the information with respect to the airborne geophysical surveys is INSPIRE-compliant. The WMS D-AERO (INSPIRE) contains for each airborne geophysical survey one layer, e.g. GE.flightLine.G081Cuxhaven. The flightlines are displayed correspondingly to the INSPIRE portrayal rules. Via the getFeatureInfo request, the user obtains the content of the INSPIRE attributes platformType und profileType. Additionally, the WMS contains a campaign layer (GE.airborneGeophysicalSurvey) with the INSPIRE attributes campaignType and surveyType.