 www.geodatenkatalog.de (S3L)
Keyword
Geoscientific information
29103 record(s)
Provided by
Type of resources
Available actions
Topics
Keywords
Contact for the resource
Update frequencies
Service types
-
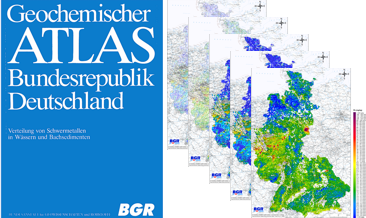
Between 1977 and 1983, the Federal Institute for Geosciences and Natural Resources (BGR) took approx. 80,000 water samples and 70,000 sediment samples from streams and rivers in several sampling campaigns on the territory of the Federal Republic of Germany at that time and examined them geochemically. In addition to the geochemical prospection of areas with potentially deposits, the aim of the investigations was also to record indications of anthropogenic environmental pollution. The results of these investigations were published in the Geochemical Atlas of the Federal Republic of Germany (Fauth et al., 1985). The data collected within the framework of the Geochemical Atlas of the Federal Republic of Germany in 1985 is a geochemical survey of the former territory of the Federal Republic of Germany which is unique in its high sampling density. All later geochemical investigations were carried out with a much lower sampling density. This valuable and irretrievable data is now being made generally available via the BGR geoportals. In addition to the digital provision of the original data material, the texts from Fauth et al. (1985) and distribution maps produced according to the method used in 1985, the data were reprocessed using modern methods. The downloads show the distribution of Uranium concentrations in stream sediments in five different coloured point and colour shaded contour maps. In addition, the brief explanations on the element Uranium from Fauth et al. (1985) are included.
-
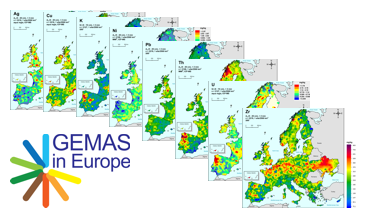
GEMAS (Geochemical Mapping of Agricultural and Grazing Land Soil in Europe) is a cooperative project between the Geochemistry Expert Group of EuroGeoSurveys and Eurometeaux. In total, more than 60 international organisations and institutions worldwide were involved in the implementation of the project. During 2008 and 2009, a total of 2219 samples of agricultural (arable land soils, 0 – 20 cm, Ap samples) and 2127 samples of grazing land (pasture land soils, 0 – 10 cm, Gr samples) soil were collected at a density of 1 site/2 500 km² each from 33 European countries, covering an area of 5,600,000 km². In addition to the chemical element contents, soil properties and soil parameters such as pH, particle size distribution, effective cation exchange capacity (CEC), MIR spectra and magnetic susceptibility were investigated in the samples and some coefficients were calculated. The downloadable files present the areal distribution of the determined Kd values (soil-solution partitioning values) for Cobalt (Co) in the shape of colour shaded contour maps.
-
This input dataset contains the individual stratigraphic horizons of the dynamic hydrocarbon model of the central German North Sea in the form of depth maps, maps for erosion and salt tectonics, and default values of the model boundary conditions (SWIT, PWD, and HF trends). The model is created using the software package PetroMod, Schlumberger version 2012.2 and converted to 2013.2, 2014.1 and 2015.1. The model is capable of simulation. The KW model of the central German North Sea contains layers merged from different sources. The Zechstein to MMU (Middle Miocene Unconformity) layers are based on modified depth maps from the Generalized Structural Model of the Central German North Sea (GSN) and the seafloor surface map is from GTA3D (Bombien et al. 2012). The Upper Rotliegend and Upper Carboniferous layers were compiled from literature data. The compilation was done considering the maps for the base horizons Zechstein to seafloor surface modified for the input model.
-
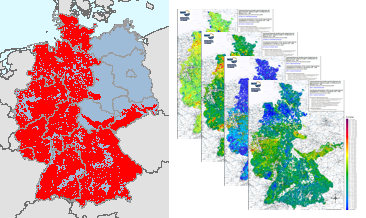
Between 1975 and 1986, geochemical investigations were carried out by the Federal Institute for Geosciences and Natural Resources (BGR) on the territory of the then Federal Republic of Germany and by the Central Geological Institute (ZGI) of the former GDR in the area of the pre-Upper Permian bedrock units in the southern part of the former GDR, which lie on the earth's surface or are slightly covered by the Cenozoic. Approximately 98,000 water and 87,500 stream sediment samples were taken and geochemically analysed. The results of these investigations were published in the "Geochemical Atlas of the Federal Republic of Germany" (Fauth et al., 1985) and in the "Final Report on the Comparative Evaluation of the Raw Material Potential in the Bedrock Units of the GDR" (Röllig et al., 1990; in German). The geochemical data collected as part of these investigations, which cover a large part of the area of today's Federal Republic of Germany, are unique in their high sampling density. All subsequent geochemical investigations were carried out with a much lower sample density. These valuable and irretrievable data have been generally accessible via the BGR geoportal since their digital processing and provision in 2022 (Geochemical Atlas of the Federal Republic of Germany) and 2023 (Geochemical Prospection in the bedrock units in the southern part of the former GDR). However, a direct comparison of the maps produced for the two sub-areas is not possible due to the differences in the analytical methods used in the investigations (investigated element spectrum, analytical quality, determination limits, ...). Nevertheless, for some of the investigated elements and parameters it is possible to summarise the results of these geochemical investigations, which are unique in their high occupancy density, with appropriate adjustments (determination limits, representable content ranges, classification of the map legends, ...). Such summarised representations are now being made available for the first time via the BGR geoportal. The downloads show the distribution of Electrical conductivity in stream waters in four different coloured point and colour shaded contour maps.
-
Between 1975 and 1986, geochemical investigations were carried out by the Federal Institute for Geosciences and Natural Resources (BGR) on the territory of the then Federal Republic of Germany and by the Central Geological Institute (ZGI) of the former GDR in the area of the pre-Upper Permian bedrock units in the southern part of the former GDR, which lie on the earth's surface or are slightly covered by the Cenozoic. Approximately 98,000 water and 87,500 stream sediment samples were taken and geochemically analysed. The results of these investigations were published in the "Geochemical Atlas of the Federal Republic of Germany" (Fauth et al., 1985) and in the "Final Report on the Comparative Evaluation of the Raw Material Potential in the Bedrock Units of the GDR" (Röllig et al., 1990; in German). The geochemical data collected as part of these investigations, which cover a large part of the area of today's Federal Republic of Germany, are unique in their high sampling density. All subsequent geochemical investigations were carried out with a much lower sample density. These valuable and irretrievable data have been generally accessible via the BGR geoportal since their digital processing and provision in 2022 (Geochemical Atlas of the Federal Republic of Germany) and 2023 (Geochemical Prospection in the bedrock units in the southern part of the former GDR). However, a direct comparison of the maps produced for the two sub-areas is not possible due to the differences in the analytical methods used in the investigations (investigated element spectrum, analytical quality, determination limits, ...). Nevertheless, for some of the investigated elements and parameters it is possible to summarise the results of these geochemical investigations, which are unique in their high occupancy density, with appropriate adjustments (determination limits, representable content ranges, classification of the map legends, ...). Such summarised representations are now being made available for the first time via the BGR geoportal. The downloads show the distribution of Barium contents in stream sediments in four different coloured point and colour shaded contour maps.
-
Between 1975 and 1986, geochemical investigations were carried out by the Federal Institute for Geosciences and Natural Resources (BGR) on the territory of the then Federal Republic of Germany and by the Central Geological Institute (ZGI) of the former GDR in the area of the pre-Upper Permian bedrock units in the southern part of the former GDR, which lie on the earth's surface or are slightly covered by the Cenozoic. Approximately 98,000 water and 87,500 stream sediment samples were taken and geochemically analysed. The results of these investigations were published in the "Geochemical Atlas of the Federal Republic of Germany" (Fauth et al., 1985) and in the "Final Report on the Comparative Evaluation of the Raw Material Potential in the Bedrock Units of the GDR" (Röllig et al., 1990; in German). The geochemical data collected as part of these investigations, which cover a large part of the area of today's Federal Republic of Germany, are unique in their high sampling density. All subsequent geochemical investigations were carried out with a much lower sample density. These valuable and irretrievable data have been generally accessible via the BGR geoportal since their digital processing and provision in 2022 (Geochemical Atlas of the Federal Republic of Germany) and 2023 (Geochemical Prospection in the bedrock units in the southern part of the former GDR). However, a direct comparison of the maps produced for the two sub-areas is not possible due to the differences in the analytical methods used in the investigations (investigated element spectrum, analytical quality, determination limits, ...). Nevertheless, for some of the investigated elements and parameters it is possible to summarise the results of these geochemical investigations, which are unique in their high occupancy density, with appropriate adjustments (determination limits, representable content ranges, classification of the map legends, ...). Such summarised representations are now being made available for the first time via the BGR geoportal. The downloads show the distribution of Zinc contents in stream sediments in four different coloured point and colour shaded contour maps.
-
Between 1975 and 1986, geochemical investigations were carried out by the Federal Institute for Geosciences and Natural Resources (BGR) on the territory of the then Federal Republic of Germany and by the Central Geological Institute (ZGI) of the former GDR in the area of the pre-Upper Permian bedrock units in the southern part of the former GDR, which lie on the earth's surface or are slightly covered by the Cenozoic. Approximately 98,000 water and 87,500 stream sediment samples were taken and geochemically analysed. The results of these investigations were published in the "Geochemical Atlas of the Federal Republic of Germany" (Fauth et al., 1985) and in the "Final Report on the Comparative Evaluation of the Raw Material Potential in the Bedrock Units of the GDR" (Röllig et al., 1990; in German). The geochemical data collected as part of these investigations, which cover a large part of the area of today's Federal Republic of Germany, are unique in their high sampling density. All subsequent geochemical investigations were carried out with a much lower sample density. These valuable and irretrievable data have been generally accessible via the BGR geoportal since their digital processing and provision in 2022 (Geochemical Atlas of the Federal Republic of Germany) and 2023 (Geochemical Prospection in the bedrock units in the southern part of the former GDR). However, a direct comparison of the maps produced for the two sub-areas is not possible due to the differences in the analytical methods used in the investigations (investigated element spectrum, analytical quality, determination limits, ...). Nevertheless, for some of the investigated elements and parameters it is possible to summarise the results of these geochemical investigations, which are unique in their high occupancy density, with appropriate adjustments (determination limits, representable content ranges, classification of the map legends, ...). Such summarised representations are now being made available for the first time via the BGR geoportal. The downloads show the distribution of the sample points and the sampled area in the form of a (smoothed) buffer around the sample points.
-
GEMAS (Geochemical Mapping of Agricultural and Grazing Land Soil in Europe) is a cooperative project between the Geochemistry Expert Group of EuroGeoSurveys and Eurometeaux. In total, more than 60 international organisations and institutions worldwide were involved in the implementation of the project. During 2008 and 2009, a total of 2219 samples of agricultural (arable land soils, 0 – 20 cm, Ap samples) and 2127 samples of grazing land (pasture land soils, 0 – 10 cm, Gr samples) soil were collected at a density of 1 site/2 500 km² each from 33 European countries, covering an area of 5,600,000 km². All samples were analysed for 52 chemical elements after an aqua regia extraction, 41 by XRF (total), TC and TOC. In the agricultural soil samples, 57 elements in a mobile metal ion (MMI®) extraction and Pb isotopes ratios were also analysed. In addition to the chemical element contents, soil properties and soil parameters such as pH, particle size distribution, effective cation exchange capacity (CEC), MIR spectra and magnetic susceptibility were investigated and some coefficients were calculated. All analytical results were subject to tight external quality control procedures. The GEMAS project thus provides for the first time fully harmonised data for element concentrations and bioavailability of the elements at the continental (European) scale. The geochemical maps provided in the data series “GEMAS - Single element maps” and “GEMAS - Parameters and indices” show an unbiased representation of the distribution patterns of the investigated elements and parameters. The data series “GEMAS - Supporting information” provides additional information to support the interpretation of these geochemical maps. The data set “Soil types” belonging to this data series provides maps of the distribution of soil types in the project survey area. The information on soil types is based on the results of the investigation of the particle size distribution in the samples.
-
The idea to represent the main features of the European Quaternary was first discussed at the Second Congress of the International Union for Quaternary Research (INQUA) held in Leningrad (St. Petersburg) in 1932. Compiled by the Federal Institute for Geosciences and Natural Resources (BGR) in cooperation with the INQUA, the International Quaternary Map of Europe 1 : 2.500.000 was finished in 1995. It is jointly published by the BGR and UNESCO. Several Quaternary features such as end moraines, ground moraine hillocks, kames, drumlins, eskers and ice border lines are represented on the map. Additionally, the map shows the directions of ice movements, limits of marine transgressions and tectonic faults. Important localities of Quaternary discovery relating to both geology and prehistory, bathymetric lines and recent deposits covering the sea floor are also indicated as well. The legend on each of the 14 map sheets is in German and, depending on the territories covered, in English, French or Russian. The general legend is placed on map sheet number 15.
-
GEMAS (Geochemical Mapping of Agricultural and Grazing Land Soil in Europe) is a cooperative project between the Geochemistry Expert Group of EuroGeoSurveys and Eurometeaux. In total, more than 60 international organisations and institutions worldwide were involved in the implementation of the project. During 2008 and 2009, a total of 2219 samples of agricultural (arable land soils, 0 – 20 cm, Ap samples) and 2127 samples of grazing land (pasture land soils, 0 – 10 cm, Gr samples) soil were collected at a density of 1 site/2 500 km² each from 33 European countries, covering an area of 5,600,000 km². All samples were analysed for 52 chemical elements after an aqua regia extraction, 41 by XRF (total), TC and TOC. In addition, the agricultural soil samples were analysed for 57 elements in a mobile metal ion (MMI®) extraction and Pb isotopes. All analytical results were subject to tight external quality control procedures. The GEMAS project thus provides for the first time fully harmonised data for element concentrations and bioavailability of the elements at the continental (European) scale. The downloadable files present the areal distribution of the element contents determined by different analytical methods in the shape of colour shaded contour maps with a classification in 7 and 72 levels each.