 My GeoNetwork catalogue
Grundwasserneubildung
Provided by
Type of resources
Available actions
Topics
Keywords
Contact for the resource
Update frequencies
Service types
-
The World-wide Hydrogeological Map Information System (WHYMIS) offers information on the availability of hydrogeological and other groundwater related maps at national (country) and international (continent) level.
-
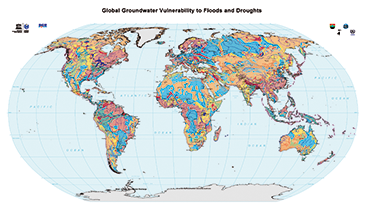
The World-wide Hydrogeological Mapping and Assessment Programme (WHYMAP) provides data and information about the earth´s major groundwater resources. The Map of Global Groundwater Vulnerability to Floods and Droughts indicates the vulnerability level of groundwater resources of the earth. It presents the intrinsic vulnerability of groundwater systems and the sensitivity or resistance of those systems to natural disasters.
-
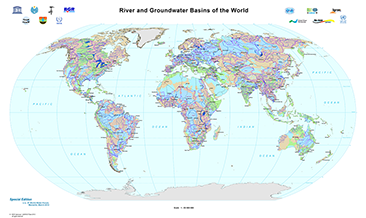
The World-wide Hydrogeological Mapping and Assessment Programme (WHYMAP) provides data and information about the earth´s major groundwater resources. The River and Groundwater Basins Map shows the areal extent of the global groundwater and surface water basins.
-

The World-wide Hydrogeological Mapping and Assessment Programme (WHYMAP) provides data and information about the earth´s major groundwater resources. The Groundwater Resources Map shows various characteristic groundwater environments in their areal extent and classified by their aquifer productivity and recharge potential. Additional groundwater related features such as wetlands and areas of low rainfall are included in the dataset.
-
The World-wide Hydrogeological Map Information System (WHYMIS) offers information on the availability of hydrogeological and other groundwater related maps at national (country) and international (continent) level.
-
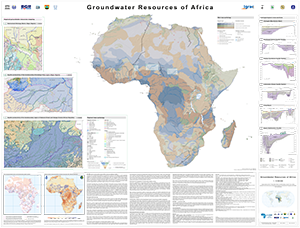
The Groundwater Resources of Africa Map represents the current state of WHYMAP’s groundwater resources mapping in Africa and was prepared for the 7th Africa Water Week 2018 in Libreville (Gabon). It includes novel features, such as cross-sections and regional transboundary hydrogeological maps, bringing together generalised overview maps and regional hydrogeological studies, thereby adding value through the inclusion of higher resolution spatial information in regions where ongoing BGR technical cooperation projects are taking place. These regional mapping activities methodologically follow the spirit of the development of the International Hydrogeological Map of Europe (IHME1500), the only harmonised, pan-European dataset at a scale of 1:1?500?000. For the IHME1500, a lithological classification scheme was developed at BGR (Duscher et al., 2015) and combined with the Standard Legend for Hydrogeological Maps (SLHyM) of Struckmeier & Margat (1995). The regional maps apply this European approach to the mapping of groundwater resources in Africa. These medium-scale maps are a further step towards regional integrated water resources planning and allow for specific analyses, such as vulnerability assessments of groundwater resources to climate change and pollution. The World-wide Hydrogeological Mapping and Assessment Programme (WHYMAP) is a joint programme consisting of a consortium composed by the UNESCO, the Commission for the Geological Map of the World (CGMW), the International Association of Hydrogeologists (IAH), the International Atomic Energy Agency (IAEA), the International Groundwater Resources Assessment Centre (IGRAC), and the German Federal Institute for Geosciences and Natural Resources (BGR). Its main objective is to contribute to the global effort to better understand, manage and protect aquifer resources, and to communicate this groundwater-related information appropriately to groundwater experts, non-experts and policy-makers.
-
The World-wide Hydrogeological Mapping and Assessment Programme (WHYMAP) provides data and information about the earth´s major groundwater resources. The River and Groundwater Basins Map shows the areal extent of the global groundwater and surface water basins.
-
The World-wide Hydrogeological Mapping and Assessment Programme (WHYMAP) provides data and information about the earth´s major groundwater resources. The Map of Global Groundwater Vulnerability to Floods and Droughts indicates the vulnerability level of groundwater resources of the earth. It presents the intrinsic vulnerability of groundwater systems and the sensitivity or resistance of those systems to natural disasters.
-
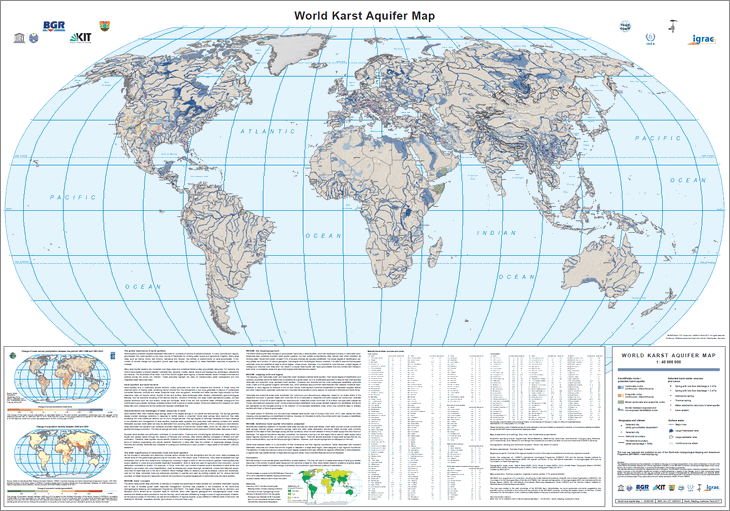
The World-wide Hydrogeological Mapping and Assessment Programme (WHYMAP) provides data and information about the earth´s major groundwater resources. The World Karst Aquifer Map (WOKAM) allows a more precise global quantification of karst systems. The map will help to increase awareness of karst groundwater resources in the context of global water issues and will serve as a basis for other karst-related research questions at global scales: for example those related to climate change, biodiversity, food production, geochemical cycles and urbanisation.