 My GeoNetwork catalogue
Land
Provided by
Type of resources
Available actions
Topics
Keywords
Contact for the resource
Update frequencies
Service types
-
The file “GCOS_EHI_1960-2020_Continental_Heat_Content_data.nc” presents an updated estimate of the global continental heat storage for the period 1960-2020. For the first time, the continental heat storage is assessed as composed by: ground heat storage due to changes in subsurface temperatures, inland water heat storage due to the warming of inland water bodies, and permafrost heat storage due to thawing of ground ice in the Arctic. Furthermore, we argue that all three components of the continental heat storage should be monitored independently of their relative magnitude, as heat gain in the three components alters several important climate phenomena affecting society and ecosystems. This file contains the total continental heat storage relative to 1960. The ground heat storage has been estimated by inverting 1079 subsurface temperature profiles form the Xibalbá database (https://figshare.com/articles/dataset/Xibalb_Underground_Temperature_Database/13516487) and a bootstrap technique to aggregate the Singular Value Decomposition (SVD) inversions of each profile (Cuesta-Valero et al., 2022a). The data are used in Cuesta-Valero et al. (2022b) and von Schuckmann et al. (2022).
-
The file “GCOS_EHI_1960-2020_Continental_Heat_Content_data.nc” presents an updated estimate of the global continental heat storage for the period 1960-2020. For the first time, the continental heat storage is assessed as composed by: ground heat storage due to changes in subsurface temperatures, inland water heat storage due to the warming of inland water bodies, and permafrost heat storage due to thawing of ground ice in the Arctic. Furthermore, we argue that all three components of the continental heat storage should be monitored independently of their relative magnitude, as heat gain in the three components alters several important climate phenomena affecting society and ecosystems. This file contains the total continental heat storage relative to 1960. The ground heat storage has been estimated by inverting 1079 subsurface temperature profiles form the Xibalbá database (https://figshare.com/articles/dataset/Xibalb_Underground_Temperature_Database/13516487) and a bootstrap technique to aggregate the Singular Value Decomposition (SVD) inversions of each profile (Cuesta-Valero et al., 2022a). The data are used in Cuesta-Valero et al. (2022b) and von Schuckmann et al. (2022). This version includes an update of continental heat content uncertainty, where the standard deviation has been corrected from the precedent version to consider properly the value from permafrost heat storage uncertainty.
-

The SAR4Tectonics project aims to provide open-access, global measurements of ground deformation in high-strain areas near tectonic plate boundaries. By leveraging the capabilities of the Persistent and Distributed Scatterer (PS/DS) technique with Sentinel-1 SAR images, the project seeks to deliver comprehensive and accurate data on ground deformation, which is crucial for understanding geological processes, assessing seismic risks in these regions, and advance our understanding of Earth's dynamic processes in general. The PS/DS technique offers significantly denser spatial coverage than GNSS, enabling the detection of more localized deformation signals. For the first time, such a vast and detailed dataset is made publicly available. By making this data openly accessible, the SAR4Tectonics project hopes to reduce the burden of SAR data processing for geoscientists, facilitating future studies.The project involved processing 6.5 years of SAR data, focusing on areas where the second invariant of strain exceeds 3 nanostrain per year. Various error corrections were employed, including tropospheric delay correction using ECMWF reanalysis data, ionospheric mitigation via CODE total electron content maps, and solid earth tide modeling. Additionally, the impact of vegetation and soil moisture on distributed scatterers was minimized through a full covariance matrix (phase linking) approach, and the results were calibrated using GNSS data. The final dataset includes line-of-sight average velocity maps, deformation time series, projection vectors, and reference plate modeled velocities.
-
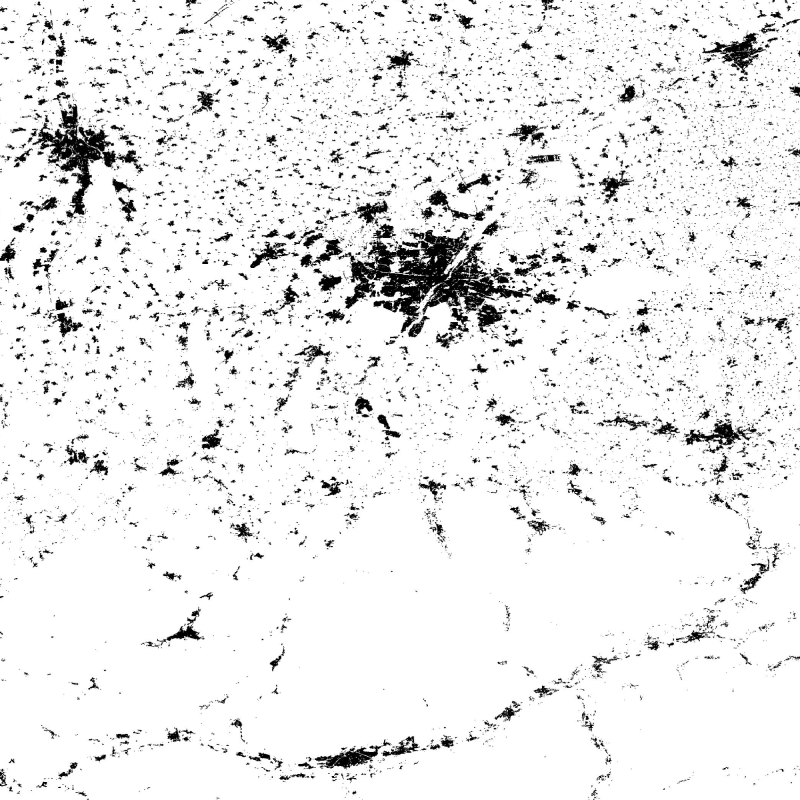
The Global Urban Footprint® (GUF®) dataset is based on the radar (SAR) satellite imagery of the German satellites TerraSAR-X and TanDEM-X. By creating the GUF database, scientists at the German Remote Sensing Data Center (DFD) of the German Aerospace Center (DLR) have succeeded in using a newly developed method to generate a global raster map of the world’s built-up pattern in a so far unprecedented spatial resolution of about 12m per raster cell. Using a fully automated processing system, a global coverage of more than 180,000 very high resolution SAR images (3m ground resolution) has been analyzed acquired between 2010 and 2013. Thereby, the backscatter amplitudes of the SAR data have been used in combination with derived textural information to delineate human settlements in a highly automated, complex decision-making process. The evaluation procedure based mainly on radar signals detects the characteristic vertical structures of human habitations – primarily built-up areas. In addition, auxiliary data such as digital elevation models have been included to improve the classification process. In total, over 20 million datasets were processed with a combined volume of about 320 terabytes. The final global maps show three coverage categories (e. g. in a B/W representation): Built-up areas (vertical structures only) in black, non-built-up surfaces in white, areas of no coverage by TSX/TDX satellites (NoData) as most parts of the oceans in grey. The final product has been optimized for fast online access through web services by merging the 5 x 5 degree GUF tiles into a single global mosaic. Furthermore reduced resolution overviews have been generated with an interpolation algorithm, that computes the average value of all contribution pixels. The global mosaic uses PackBits compression to reduce file size. (GUF® and Global Urban Footprint® are protected as trademarks.)
-

The SoilSuite contains a collection of different image data products that provide information about the spectral and statistical properties of soils and other bare surfaces of three East-African countries (Rwanda, Kenya and Ethiopia). It is created using DLR's Soil Composite Mapping Processor (ScMAP), which utilises the Sentinel-2 data archive. SCMaP is a specialised processing chain for detecting and analysing bare soils/surfaces on a large (continental) scale. Bare surface and soil pixels are selected using a combined NDVI and NBR index (PVIR2) that optimises the exclusion of photosynthetically active and non-active vegetation. The index is calculated and applied for each individual pixel. All SoilSuite products are calculated based on the available Sentinel-2 scenes recorded between January 2018 and December 2021 in the target region. The data package excludes all scenes with a cloud cover of larger than 80 percent and a sun elevation of less than 20 degrees. The spectral composite products are calculated from the mean value after extensive removal of clouds, haze and snow effects at both scene and pixel level. The spectral data products are available at a pixel size of 20 m and contain 10 Sentinel-2 bands (B02, B03, B04, B05, B06, B07, B08, B08a, B11, B12). The SoilSuite comprises: (a) “Bare Surface Reflectance Composite – Mean” that provides the spectral properties of soils that vary due to different soil organic carbon (SOC) content, soil moisture and soil minerology. This product is often used for spectral and digital soil mapping approaches, (b) “Bare Surface Reflectance Composite - Standard deviation” informing about the spectral dynamic of bare surfaces and soils, (c) “Bare Surface Reflectance Composite – 95% Confidence” contains information about the reliability of the spectral information due to the number of valid observations per pixel, (d) “Bare Surface Statistics Product” provides the number of bare soil occurrences over the total number of valid observations (Band 1), the number of bare soil occurrences (Band 2) and the total number of valid observations (Band 3), (e) “Mask” is a product that aggregates simple landcover classes that occur during the time period between 2018 - 2021 (Sentinel-2). The three-class Mask contains bare surface occurrences (1), permanent vegetation (2) and other surfaces such as water bodies, urban areas, roads (3). Additionally, the SoilSuite provides (f) “Reflectance Composite – Mean” that represents the mean reflectance of all valid Sentinel-2 observations between 2018 – 2021 including vegetation, bare and other surfaces, and (g) “Reflectance Composite – Standard deviation”, which contains the standard deviation per band for all valid Sentinel-2 observations between 2018 – 2021. The SoilSuite Africa was produced as part of the Earth Observation-based derivation of soil information funded by the project 'Land, Soil and Crop Information Services (LSC-IS) to support Climate-Smart Agriculture (DeSIRA)'. LSC-IS is funded by the European Union through its DeSIRA program and the Netherlands' Ministry of Foreign Affairs, with a contribution from ISRIC - World Soil Information.
-

The SoilSuite contains a collection of different image data products that provide information about the spectral and statistical properties of European soils and other bare surfaces such as rocks. It is created using DLR's Soil Composite Mapping Processor (ScMAP), which utilises the Sentinel-2 data archive. SCMaP is a specialised processing chain for detecting and analysing bare soils/surfaces on a large (continental) scale. Bare surface and soil pixels are selected using a combined NDVI and NBR index (PVIR2) that optimises the exclusion of photosynthetically active and non-active vegetation. The index is calculated and applied for each individual pixel. All SoilSuite products are calculated based on the available Sentinel-2 scenes recorded between January 2018 and December 2022 in Europe. The data package excludes all scenes with a cloud cover of > 80 % and a sun elevation of < 20°. The spectral composite products are calculated from the mean value after extensive removal of clouds, haze and snow effects at both scene and pixel level. The spectral data products are available at a pixel size of 20 m and contain 10 Sentinel-2 bands (B02, B03, B04, B05, B06, B07, B08, B08a, B11, B12). The SoilSuite comprises: (a) “Bare Surface Reflectance Composite – Mean” that provides the spectral properties of soils that vary due to different soil organic carbon (SOC) content, soil moisture and soil minerology. This product is often used for spectral and digital soil mapping approaches, (b) “Bare Surface Reflectance Composite - Standard deviation” informing about the spectral dynamic of bare surfaces and soils, (c) “Bare Surface Reflectance Composite – 95% Confidence” contains information about the reliability of the spectral information due to the number of valid observations per pixel, (d) “Bare Surface Statistics Product” provides the number of bare soil occurrences over the total number of valid observations (Band 1), the number of bare soil occurrences (Band 2) and the total number of valid observations (Band 3), (e) “Mask” is a product that aggregates simple landcover classes that occur during the time period between 2018 - 2022 (Sentinel-2). The three-class Mask contains bare surface occurrences (1), permanent vegetation (2) and other surfaces such as water bodies, urban areas, roads (3). Additionally, the SoilSuite provides (f) “Reflectance Composite – Mean” that represents the mean reflectance of all valid Sentinel-2 observations between 2018 – 2022 including vegetation, bare and other surfaces, and (g) “Reflectance Composite – Standard deviation”, which contains the standard deviation per band for all valid Sentinel-2 observations between 2018 – 2022.
-
Darstellung der Landesgrenze des Landes Bremen in der Stadt Bremerhaven.
-
Dieser WFS (Web Feature Service) stellt die digitalen Planungsdaten der Bebauungspläne der Freien und Hansestadt Hamburg im INSPIRE Zielmodell bereit. Die Daten wurden aus dem XPlanung Objektmodell ins Planned Land Use (PLU) GML application Schema transformiert. Bebauungspläne (Verbindliche Bauleitpläne) sind rechtsverbindliche Pläne, zu denen Baustufenpläne, Teilbebauungspläne, Durchführungspläne und seit 1962 die heutigen Bebauungspläne nach dem Bundesbaugesetz (BBauG) bzw. ab 1986 nach dem Baugesetzbuch (BauGB) zu zählen sind. Die Bebauungspläne bestehen aus der Planzeichnung, dem Gesetzes- bzw. Verordnungstext mit den textlichen Festsetzungen sowie einer Begründung. Bebauungspläne treffen für kleinere Gebiete die verbindlichen Festsetzungen für die Bebauung und sonstige Nutzung der Grundstücke. Sie sind aus dem Flächennutzungsplan (Vorbereitender Bauleitplan) zu entwickeln. Zur genaueren Beschreibung der Daten und Datenverantwortung nutzen Sie bitte den Verweis zur Datensatzbeschreibung.
-
Dieser WMS (Web Map Service) stellt die digitalen Planungsdaten der Bebauungspläne der Freien und Hansestadt Hamburg im INSPIRE Zielmodell dar. Die Daten wurden aus dem XPlanung Objektmodell ins Planned Land Use (PLU) GML application Schema transformiert. Bebauungspläne (Verbindliche Bauleitpläne) sind rechtsverbindliche Pläne, zu denen Baustufenpläne, Teilbebauungspläne, Durchführungspläne und seit 1962 die heutigen Bebauungspläne nach dem Bundesbaugesetz (BBauG) bzw. ab 1986 nach dem Baugesetzbuch (BauGB) zu zählen sind. Die Bebauungspläne bestehen aus der Planzeichnung, dem Gesetzes- bzw. Verordnungstext mit den textlichen Festsetzungen sowie einer Begründung. Bebauungspläne treffen für kleinere Gebiete die verbindlichen Festsetzungen für die Bebauung und sonstige Nutzung der Grundstücke. Sie sind aus dem Flächennutzungsplan (Vorbereitender Bauleitplan) zu entwickeln. Zur genaueren Beschreibung der Daten und Datenverantwortung nutzen Sie bitte den Verweis zur Datensatzbeschreibung.
-
Straßenbrunnen sind handbetriebene Pumpen, die Grundwasser fördern. Sie dienen der Trinkwasserversorgung der Berliner Bevölkerung in Notfällen. Sie unterliegen der hygienischen Überwachung durch die Gesundheitsämter und werden durch die Tiefbauämter der Bezirke betreut. Träger dieser Objekte kann der Bund ("Bundesbrunnen") oder das Land ("Landesbrunnen") sein.