 My GeoNetwork catalogue
Geoscientific information
Provided by
Type of resources
Available actions
Topics
Keywords
Contact for the resource
Update frequencies
Service types
-
The Federal Institute for Geosciences and Natural Resources (BGR) was commissioned by the Federal Company for Radioactive Waste Disposal (BGE) within the framework of an existing cooperation agreement (BGE & BGR 2018) with the work package “Database on salt structures, variability study, and development of a prediction method for the internal structure of salt structures” (AP No.: 9S2022020000). As part of this work, well-explored salt structures were examined in detail with regard to their internal structure, and geological factors that led to the formation of the internal structure were derived from this. Using the method developed, the 60 sub-areas identified by BGE in rock salt in steeply dipping deposits can be systematically evaluated with regard to their geological conditions for finding sufficiently large host rock areas with a barrier effect (WbB). One geological factor that can be used to assess the complexity of the internal structure of salt diapirs is the primary rock salt thickness. The data available for a reliable prognosis of the spatial and proportional distribution of rock salt within salt structures in the North German Basin is currently still insufficient. In order to evaluate this geological factor for all 60 specified sub-areas, a map base for the North German Basin (NDB) with region-specific data on the primary thickness of the rock salt in the Staßfurt Formation (z2Na) is required. The data set contains grid data of the North German Basin (NDB) created as part of the work package "Datenbasis zu Salzstrukturen, Variabilitätsstudie und Entwicklung einer Prognosemethode zum Internbau von Salzstrukturen", with region-specific information on the primary thickness of the rock salt in the Staßfurt Formation (z2Na) and supplementary intermediate calculation steps in three file geodatabases (.gdb). Based on a processed, compiled basic data set, four geoscientists developed independetly different models from which a preferred model and the range, median, minimum, maximum, and mean values of all models were defined. The data will be made available shortly.
-
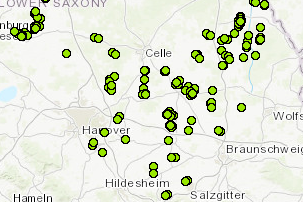
The point map shows samples of the BGR-petroleum archive, which are stored at the Federal Institute for Geosciences and Natural Resources (BGR). The map contains drill sites and selected information on the well including well names and NIBIS-well identifiers (NIBIS Kartenserver des Landesamtes für Bergbau und Geologie Niedersachsens). Petroleum samples are stored in different quantities and are usually stored cool. For many of the samples geochemical data are available at BGR like relative amounts of aliphatic and aromatic hydrocarbons, isotopic compositions of individual fractions (delta13C) as well as ratios of selected aliphatic hydrocarbons and biomarkers (particularly steranes and hopanes). Samples and data are stored for internal use only due to legal issues. BGR may help with making a contact.
-
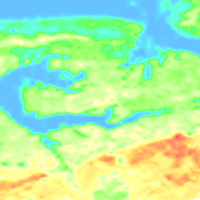
This dataset has been compiled within the BGR project "D-AERO-Auswertung" based on several survey area located along the German North Sea coast. The BGR helicopter (Sikorsky S-76B) is used for airborne geophysical surveying of the Earth’s subsurface. The standard equipment comprises the methods electromagnetics, magnetics and radiometrics. The passive radiometric (HRD) system is installed into the helicopter and consists of a gamma-ray spectrometer with five Sodiumiodid detectors to measure the gamma radiation. The results are as maps displaying total count, exposure rate as well as (equivalent) concentrations of Potassium, Thorium and Uranium at ground level.
-
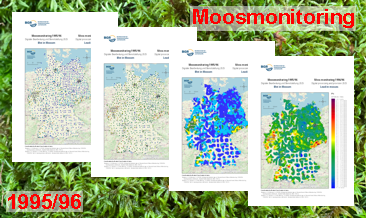
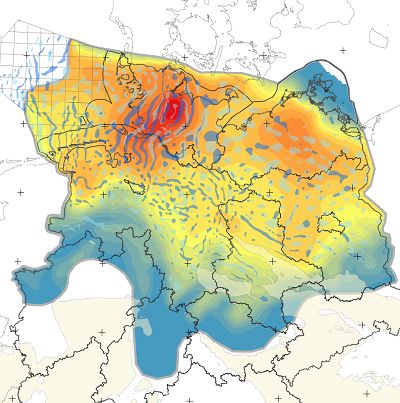
In the Federal Republic of Germany, analyses to determine the constituents of mosses were carried out at five-year intervals from 1990 to 2005 and in 2015/16 and 2020/21. The focus was on analysing heavy metals, and from 2005/06 also nitrogen. Since 2015/16, the range of substances has been expanded to include persistent organic pollutants (POPs) and microplastics. This moss monitoring is the German contribution to the European moss monitoring programme, which is coordinated by the ‘International Cooperative Programme on Effects of Air Pollution on Natural Vegetation and Crops’ (ICP Vegetation) of the Geneva Convention on Long-range Transboundary Air Pollution (CLRTAP). The German Environment Agency (Umweltbundesamt - UBA) has commissioned various institutions to carry out the individual sampling campaigns and analyse the results of the investigations, including the Federal Institute for Geosciences and Natural Resources (BGR) for moss monitoring in 1995/96. The UBA has published the results of subsequent monitoring years. They are available at https://www.umweltbundesamt.de/daten/luft/bioindikation-von-luftverunreinigungen. With 1026 sites, the 1995/96 moss monitoring is, alongside the 2000 moss monitoring, the one with the greatest sample density and, with 40 analysed elements, the one with the widest range of investigations. Although the research reports completed in 1998 and 1999 (Siewers & Herpin, 1998; Siewers, Herpin & Straßburg, 1999) contained an evaluation (brief description, statistical measures, distribution maps) of all 40 elements analysed, only the data of 12 of the analysed elements have been published to date. In addition, the raw data from the laboratories available as a result of the analyses were re-evaluated in 2007. This resulted in a series of error corrections and the analysable element spectrum was extended to 42 elements. The results of this re-evaluation have also not yet been published. The additional processing of the data using modern methods has further enhanced their value. The downloads show the distribution of vanadium concentrations in four different coloured dot and colour shaded contour maps. The legends of the maps can be called up either in the unit of measurement µg/g or in a unit of measurement adapted to the content range of the element shown.
-
In the Federal Republic of Germany, analyses to determine the constituents of mosses were carried out at five-year intervals from 1990 to 2005 and in 2015/16 and 2020/21. The focus was on analysing heavy metals, and from 2005/06 also nitrogen. Since 2015/16, the range of substances has been expanded to include persistent organic pollutants (POPs) and microplastics. This moss monitoring is the German contribution to the European moss monitoring programme, which is coordinated by the ‘International Cooperative Programme on Effects of Air Pollution on Natural Vegetation and Crops’ (ICP Vegetation) of the Geneva Convention on Long-range Transboundary Air Pollution (CLRTAP). The German Environment Agency (Umweltbundesamt - UBA) has commissioned various institutions to carry out the individual sampling campaigns and analyse the results of the investigations, including the Federal Institute for Geosciences and Natural Resources (BGR) for moss monitoring in 1995/96. The UBA has published the results of subsequent monitoring years. They are available at https://www.umweltbundesamt.de/daten/luft/bioindikation-von-luftverunreinigungen. With 1026 sites, the 1995/96 moss monitoring is, alongside the 2000 moss monitoring, the one with the greatest sample density and, with 40 analysed elements, the one with the widest range of investigations. Although the research reports completed in 1998 and 1999 (Siewers & Herpin, 1998; Siewers, Herpin & Straßburg, 1999) contained an evaluation (brief description, statistical measures, distribution maps) of all 40 elements analysed, only the data of 12 of the analysed elements have been published to date. In addition, the raw data from the laboratories available as a result of the analyses were re-evaluated in 2007. This resulted in a series of error corrections and the analysable element spectrum was extended to 42 elements. The results of this re-evaluation have also not yet been published. The additional processing of the data using modern methods has further enhanced their value. The downloads show the distribution of titanium concentrations in four different coloured dot and colour shaded contour maps. The legends of the maps can be called up either in the unit of measurement µg/g or in a unit of measurement adapted to the content range of the element shown.
-
In the Federal Republic of Germany, analyses to determine the constituents of mosses were carried out at five-year intervals from 1990 to 2005 and in 2015/16 and 2020/21. The focus was on analysing heavy metals, and from 2005/06 also nitrogen. Since 2015/16, the range of substances has been expanded to include persistent organic pollutants (POPs) and microplastics. This moss monitoring is the German contribution to the European moss monitoring programme, which is coordinated by the ‘International Cooperative Programme on Effects of Air Pollution on Natural Vegetation and Crops’ (ICP Vegetation) of the Geneva Convention on Long-range Transboundary Air Pollution (CLRTAP). The German Environment Agency (Umweltbundesamt - UBA) has commissioned various institutions to carry out the individual sampling campaigns and analyse the results of the investigations, including the Federal Institute for Geosciences and Natural Resources (BGR) for moss monitoring in 1995/96. The UBA has published the results of subsequent monitoring years. They are available at https://www.umweltbundesamt.de/daten/luft/bioindikation-von-luftverunreinigungen. With 1026 sites, the 1995/96 moss monitoring is, alongside the 2000 moss monitoring, the one with the greatest sample density and, with 40 analysed elements, the one with the widest range of investigations. Although the research reports completed in 1998 and 1999 (Siewers & Herpin, 1998; Siewers, Herpin & Straßburg, 1999) contained an evaluation (brief description, statistical measures, distribution maps) of all 40 elements analysed, only the data of 12 of the analysed elements have been published to date. In addition, the raw data from the laboratories available as a result of the analyses were re-evaluated in 2007. This resulted in a series of error corrections and the analysable element spectrum was extended to 42 elements. The results of this re-evaluation have also not yet been published. The additional processing of the data using modern methods has further enhanced their value. The downloads show the distribution of scandium concentrations in four different coloured dot and colour shaded contour maps. The legends of the maps can be called up either in the unit of measurement µg/g or in a unit of measurement adapted to the content range of the element shown.
-
In the Federal Republic of Germany, analyses to determine the constituents of mosses were carried out at five-year intervals from 1990 to 2005 and in 2015/16 and 2020/21. The focus was on analysing heavy metals, and from 2005/06 also nitrogen. Since 2015/16, the range of substances has been expanded to include persistent organic pollutants (POPs) and microplastics. This moss monitoring is the German contribution to the European moss monitoring programme, which is coordinated by the ‘International Cooperative Programme on Effects of Air Pollution on Natural Vegetation and Crops’ (ICP Vegetation) of the Geneva Convention on Long-range Transboundary Air Pollution (CLRTAP). The German Environment Agency (Umweltbundesamt - UBA) has commissioned various institutions to carry out the individual sampling campaigns and analyse the results of the investigations, including the Federal Institute for Geosciences and Natural Resources (BGR) for moss monitoring in 1995/96. The UBA has published the results of subsequent monitoring years. They are available at https://www.umweltbundesamt.de/daten/luft/bioindikation-von-luftverunreinigungen. With 1026 sites, the 1995/96 moss monitoring is, alongside the 2000 moss monitoring, the one with the greatest sample density and, with 40 analysed elements, the one with the widest range of investigations. Although the research reports completed in 1998 and 1999 (Siewers & Herpin, 1998; Siewers, Herpin & Straßburg, 1999) contained an evaluation (brief description, statistical measures, distribution maps) of all 40 elements analysed, only the data of 12 of the analysed elements have been published to date. In addition, the raw data from the laboratories available as a result of the analyses were re-evaluated in 2007. This resulted in a series of error corrections and the analysable element spectrum was extended to 42 elements. The results of this re-evaluation have also not yet been published. The additional processing of the data using modern methods has further enhanced their value. The downloads show the distribution of cadmium concentrations in four different coloured dot and colour shaded contour maps. The legends of the maps can be called up either in the unit of measurement µg/g or in a unit of measurement adapted to the content range of the element shown.
-
In the Federal Republic of Germany, analyses to determine the constituents of mosses were carried out at five-year intervals from 1990 to 2005 and in 2015/16 and 2020/21. The focus was on analysing heavy metals, and from 2005/06 also nitrogen. Since 2015/16, the range of substances has been expanded to include persistent organic pollutants (POPs) and microplastics. This moss monitoring is the German contribution to the European moss monitoring programme, which is coordinated by the ‘International Cooperative Programme on Effects of Air Pollution on Natural Vegetation and Crops’ (ICP Vegetation) of the Geneva Convention on Long-range Transboundary Air Pollution (CLRTAP). The German Environment Agency (Umweltbundesamt - UBA) has commissioned various institutions to carry out the individual sampling campaigns and analyse the results of the investigations, including the Federal Institute for Geosciences and Natural Resources (BGR) for moss monitoring in 1995/96. The UBA has published the results of subsequent monitoring years. They are available at https://www.umweltbundesamt.de/daten/luft/bioindikation-von-luftverunreinigungen. With 1026 sites, the 1995/96 moss monitoring is, alongside the 2000 moss monitoring, the one with the greatest sample density and, with 40 analysed elements, the one with the widest range of investigations. Although the research reports completed in 1998 and 1999 (Siewers & Herpin, 1998; Siewers, Herpin & Straßburg, 1999) contained an evaluation (brief description, statistical measures, distribution maps) of all 40 elements analysed, only the data of 12 of the analysed elements have been published to date. In addition, the raw data from the laboratories available as a result of the analyses were re-evaluated in 2007. This resulted in a series of error corrections and the analysable element spectrum was extended to 42 elements. The results of this re-evaluation have also not yet been published. The additional processing of the data using modern methods has further enhanced their value. The downloads show the distribution of gallium concentrations in four different coloured dot and colour shaded contour maps. The legends of the maps can be called up either in the unit of measurement µg/g or in a unit of measurement adapted to the content range of the element shown.
-
In the Federal Republic of Germany, analyses to determine the constituents of mosses were carried out at five-year intervals from 1990 to 2005 and in 2015/16 and 2020/21. The focus was on analysing heavy metals, and from 2005/06 also nitrogen. Since 2015/16, the range of substances has been expanded to include persistent organic pollutants (POPs) and microplastics. This moss monitoring is the German contribution to the European moss monitoring programme, which is coordinated by the ‘International Cooperative Programme on Effects of Air Pollution on Natural Vegetation and Crops’ (ICP Vegetation) of the Geneva Convention on Long-range Transboundary Air Pollution (CLRTAP). The German Environment Agency (Umweltbundesamt - UBA) has commissioned various institutions to carry out the individual sampling campaigns and analyse the results of the investigations, including the Federal Institute for Geosciences and Natural Resources (BGR) for moss monitoring in 1995/96. The UBA has published the results of subsequent monitoring years. They are available at https://www.umweltbundesamt.de/daten/luft/bioindikation-von-luftverunreinigungen. With 1026 sites, the 1995/96 moss monitoring is, alongside the 2000 moss monitoring, the one with the greatest sample density and, with 40 analysed elements, the one with the widest range of investigations. Although the research reports completed in 1998 and 1999 (Siewers & Herpin, 1998; Siewers, Herpin & Straßburg, 1999) contained an evaluation (brief description, statistical measures, distribution maps) of all 40 elements analysed, only the data of 12 of the analysed elements have been published to date. In addition, the raw data from the laboratories available as a result of the analyses were re-evaluated in 2007. This resulted in a series of error corrections and the analysable element spectrum was extended to 42 elements. The results of this re-evaluation have also not yet been published. The additional processing of the data using modern methods has further enhanced their value. The downloads show the distribution of barium concentrations in four different coloured dot and colour shaded contour maps. The legends of the maps can be called up either in the unit of measurement µg/g or in a unit of measurement adapted to the content range of the element shown.
-
In the Federal Republic of Germany, analyses to determine the constituents of mosses were carried out at five-year intervals from 1990 to 2005 and in 2015/16 and 2020/21. The focus was on analysing heavy metals, and from 2005/06 also nitrogen. Since 2015/16, the range of substances has been expanded to include persistent organic pollutants (POPs) and microplastics. This moss monitoring is the German contribution to the European moss monitoring programme, which is coordinated by the ‘International Cooperative Programme on Effects of Air Pollution on Natural Vegetation and Crops’ (ICP Vegetation) of the Geneva Convention on Long-range Transboundary Air Pollution (CLRTAP). The German Environment Agency (Umweltbundesamt - UBA) has commissioned various institutions to carry out the individual sampling campaigns and analyse the results of the investigations, including the Federal Institute for Geosciences and Natural Resources (BGR) for moss monitoring in 1995/96. The UBA has published the results of subsequent monitoring years. They are available at https://www.umweltbundesamt.de/daten/luft/bioindikation-von-luftverunreinigungen. With 1026 sites, the 1995/96 moss monitoring is, alongside the 2000 moss monitoring, the one with the greatest sample density and, with 40 analysed elements, the one with the widest range of investigations. Although the research reports completed in 1998 and 1999 (Siewers & Herpin, 1998; Siewers, Herpin & Straßburg, 1999) contained an evaluation (brief description, statistical measures, distribution maps) of all 40 elements analysed, only the data of 12 of the analysed elements have been published to date. In addition, the raw data from the laboratories available as a result of the analyses were re-evaluated in 2007. This resulted in a series of error corrections and the analysable element spectrum was extended to 42 elements. The results of this re-evaluation have also not yet been published. The additional processing of the data using modern methods has further enhanced their value. The downloads show the distribution of cobalt concentrations in four different coloured dot and colour shaded contour maps. The legends of the maps can be called up either in the unit of measurement µg/g or in a unit of measurement adapted to the content range of the element shown.